Learning Outcomes
- Plot points in the coordinate plane
The Components of the Coordinate Plane
You may have used a coordinate plane before. In this section we’ll review how to identify the coordinates of points in the coordinate plane, and plot points in the coordinate plane.
The coordinate plane consists of a horizontal axis and a vertical axis, number lines that intersect at right angles. (They are perpendicular to each other.)
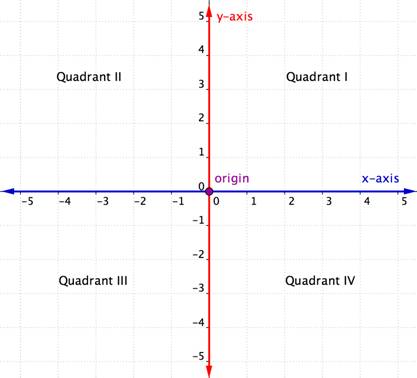
The horizontal axis in the coordinate plane is called the [latex]x[/latex]-axis. The vertical axis is called the [latex]y[/latex]-axis. The point at which the two axes intersect is called the origin. The origin is at [latex]0[/latex] on the [latex]x[/latex]-axis and [latex]0[/latex] on the [latex]y[/latex]-axis.
Locations on the coordinate plane are described as ordered pairs. An ordered pair tells you the location of a point by relating the point’s location along the [latex]x[/latex]-axis (the first value of the ordered pair) and along the [latex]y[/latex]-axis (the second value of the ordered pair).
In an ordered pair, such as [latex](x, y)[/latex], the first value is called the x-coordinate and the second value is the y-coordinate. The origin is the ordered pair [latex](0,0)[/latex]. The x-coordinate of a point describes its horizontal position, and the y-coordinate describes its vertical position.
Note: An ordered pair, such as [latex](3,2)[/latex], represents one single point on the graph. It is different than the ordered pair [latex](2,3)[/latex]. Two ordered pairs represent the same point only when their [latex]x[/latex]-coordinates are the same and their [latex]y[/latex]-coordinates are the same.
Consider the point below.
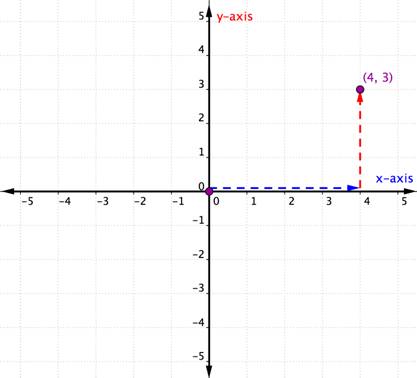
To identify the location of this point, start at the origin [latex](0, 0)[/latex] and move right along the [latex]x[/latex]-axis until you are under the point. Look at the label on the [latex]x[/latex]-axis. The [latex]4[/latex] indicates that, from the origin, you have traveled four units to the right along the [latex]x[/latex]-axis. This is the [latex]x[/latex]-coordinate, the first number in the ordered pair.
Now move to the point and notice the number it aligns on the [latex]y[/latex]-axis. The [latex]3[/latex] indicates that, after leaving the [latex]x[/latex]-axis, you traveled [latex]3[/latex] units up in the vertical direction, the direction of the [latex]y[/latex]-axis. This number is the [latex]y[/latex]-coordinate, the second number in the ordered pair. With an [latex]x[/latex]-coordinate of [latex]4[/latex] and a [latex]y[/latex]-coordinate of [latex]3[/latex], you have the ordered pair [latex](4, 3)[/latex].
Let’s look at another example.
Example
Describe the point shown as an ordered pair.
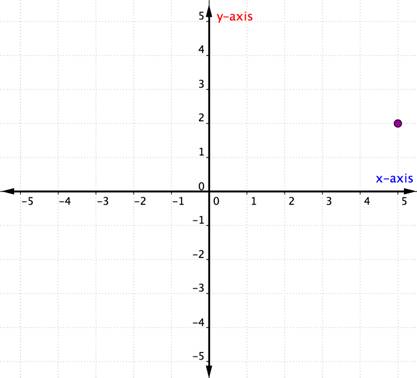
Describe the Point Shown as an Ordered Pair
Plotting Points in the Coordinate Plane
You can plot an ordered pair by starting at the origin. Move horizontally the number of units given by the [latex]x[/latex]-coordinate, and then vertically the number of units given by the [latex]y[/latex]-coordinate. The example that follows shows how to graph the ordered pair [latex](1,3)[/latex].
Example
Plot the point [latex](1, 3)[/latex].

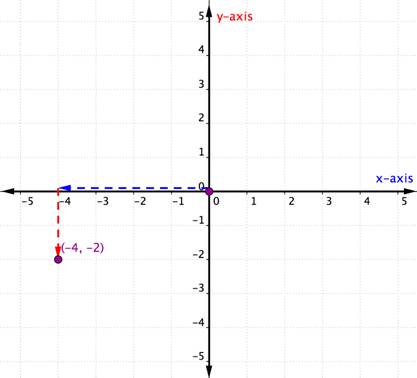
In the previous example, both the x- and y-coordinates were positive. When one (or both) of the coordinates of an ordered pair is negative, you will need to move in the negative direction along one or both axes. Consider the example below in which both coordinates are negative.
Example
Plot the point [latex](−4,−2)[/latex].
The steps for plotting a point are summarized below.
Steps for Plotting an Ordered Pair (x, y) in the Coordinate Plane
- Determine the x-coordinate. Beginning at the origin, move horizontally, the direction of the x-axis, the distance given by the x-coordinate. If the x-coordinate is positive, move to the right; if the x-coordinate is negative, move to the left.
- Determine the y-coordinate. Beginning at the x-coordinate, move vertically, the direction of the y-axis, the distance given by the y-coordinate. If the y-coordinate is positive, move up; if the y-coordinate is negative, move down.
- Draw a point at the ending location. Label the point with the ordered pair.
- An ordered pair is represented by a single point on the graph.
Plotting Points on the Coordinate Plane
Candela Citations
- Determine the Ordered Pairs for Points Plotted on the Coordinate Plane. Authored by: mathispower4u. Provided by: https://youtu.be/c9WVU34MY5Q. License: All Rights Reserved. License Terms: Standard YouTube License
- Plot Points Given as Ordered Pairs on the Coordinate Plane. Authored by: mathispower4u. Located at: https://youtu.be/p_MESleS3mw. License: All Rights Reserved. License Terms: Standard YouTube License
