Learning Outcomes
- Construct a line graph
Recall: COORDINATE PLANE
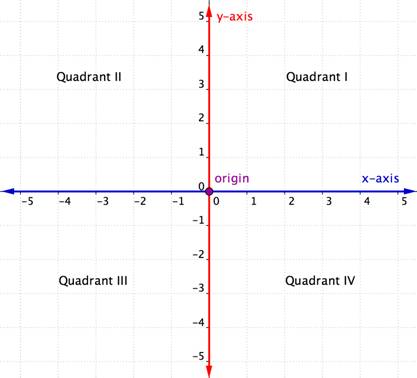
The intersecting x- and y-axes of the coordinate plane divide it into four sections. These four sections are called quadrants. Quadrants are named using the Roman numerals I, II, III, and IV, beginning with the top right quadrant and moving counter clockwise.
The rectangular coordinate system
Recall: Plotting Points
A point (also called an ordered pair) has two values: “The first value is called the x-coordinate and the second value is the y-coordinate.”

To plot a point, you go along the x-axis and find the value of the x-coordinate and then go along the y-axis and find the value of the y-coordinate.
Let’s try locating the point [latex]\left(2,5\right)[/latex]. In this ordered pair, the [latex]x[/latex]-coordinate is [latex]2[/latex] and the [latex]y[/latex]-coordinate is [latex]5[/latex].
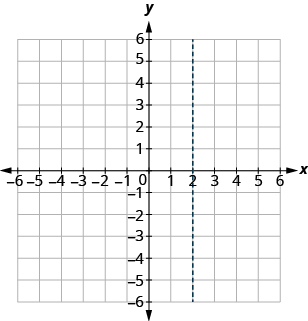
We start by locating the [latex]x[/latex] value, [latex]2[/latex], on the [latex]x\text{-axis.}[/latex] Then we lightly sketch a vertical line through [latex]x=2[/latex], as shown in the image below.
Now we locate the [latex]y[/latex] value, [latex]5[/latex], on the [latex]y[/latex] -axis and sketch a horizontal line through [latex]y=5[/latex]. The point where these two lines meet is the point with coordinates [latex]\left(2,5\right)[/latex]. We plot the point there, as shown in the image below.
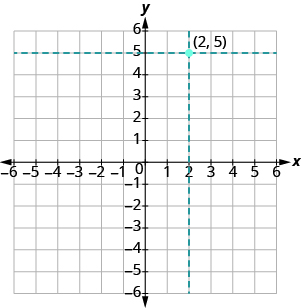
Reminder: Any ordered pair, such as (2,5), represents one single point on the graph.
Another type of graph that is useful for specific data values is a line graph. In the particular line graph shown in the next example, the x-axis (horizontal axis) consists of data values and the y-axis (vertical axis) consists of frequency points. The frequency points are connected using line segments.
Example
In a survey, 40 mothers were asked how many times per week a teenager must be reminded to do his or her chores. The results are shown in the table and figure below.
| Number of times teenager is reminded | Frequency |
|---|---|
| 0 | 2 |
| 1 | 5 |
| 2 | 8 |
| 3 | 14 |
| 4 | 7 |
| 5 | 4 |

Try It
In a survey, 40 people were asked how many times per year they had their car in the shop for repairs. The results are shown in the table below. Construct a line graph.
| Number of times in shop | Frequency |
|---|---|
| 0 | 7 |
| 1 | 10 |
| 2 | 14 |
| 3 | 9 |
Candela Citations
- OpenStax, Statistics, Stem-and-Leaf Graphs (Stemplots), Line Graphs, and Bar Graphs. Provided by: OpenStax. Located at: https://openstax.org/books/introductory-statistics/pages/2-1-stem-and-leaf-graphs-stemplots-line-graphs-and-bar-graphs. License: CC BY: Attribution. License Terms: Access for free at https://openstax.org/books/introductory-statistics/pages/1-introduction
- Introductory Statistics. Authored by: Barbara Illowsky, Susan Dean. Provided by: Open Stax. Located at: https://openstax.org/books/introductory-statistics/pages/1-introduction. License: CC BY: Attribution. License Terms: Access for free at https://openstax.org/books/introductory-statistics/pages/1-introduction
