Learning Outcomes
- Conduct a hypothesis test for one mean and interpret the conclusion in context
- In a hypothesis test problem, you may see words such as “the level of significance is 1%.” The “1%” is the preconceived or preset α.
- The statistician setting up the hypothesis test selects the value of α to use before collecting the sample data.
- If no level of significance is given, a common standard to use is α = 0.05.
- When you calculate the p-value and draw the picture, the p-value is the area in the left tail, the right tail, or split evenly between the two tails. For this reason, we call the hypothesis test left, right, or two-tailed.
- The alternative hypothesis, Ha, tells you if the test is left, right, or two-tailed. It is the key to conducting the appropriate test.
- Ha never has a symbol that contains an equal sign.
- Thinking about the meaning of the p-value: A data analyst (and anyone else) should have more confidence that he made the correct decision to reject the null hypothesis with a smaller p-value (for example, 0.001 as opposed to 0.04) even if using the 0.05 level for alpha. Similarly, for a large p-value such as 0.4, as opposed to a p-value of 0.056 (alpha = 0.05 is less than either number), a data analyst should have more confidence that she made the correct decision in not rejecting the null hypothesis. This makes the data analyst use judgment rather than mindlessly applying rules.
Recall: Inequality Symbols
An inequality is a mathematical statement that compares two expressions using the ideas of greater than or less than.
Here are some common inequalities seen in Statistics:
- < indicates less than, for example x < 5 indicates x is less than 5
- ≤ indicates less than or equal to, for example x ≤ 5 indicates x is less than or equal to 5 (5 is included)
- > indicates greater than, for example x > 5 indicates x is greater than 5
- ≥ indicates greater than or equal to, for example x ≥ 5 indicates x is greater than or equal to 5 (5 is included)
Note: Where you place the variable in the inequality statement can change the symbol you use.
For example:
- x < 5 indicates all possible numbers less than 5.
- 5 < x indicates that 5 is less than x, or we could rewrite this with the x on the left: x > 5.
Note: The inequality is still pointing the same direction relative to x. This statement represents all the real numbers that are greater than 5, which is easier to interpret than 5 is less than x.
The following examples illustrate a left-, right-, and two-tailed test.
Example 1
Ho: μ = 5, Ha: μ < 5
Test of a single population mean. Ha tells you the test is left-tailed. The picture of the p-value is as follows:

TRY IT 1
H0: μ = 10, Ha: μ < 10
Assume the p-value is 0.0935. What type of test is this? Draw the picture of the p-value.

Example 2
H0: p ≤ 0.2, Ha: p > 0.2
This is a test of a single population proportion. Ha tells you the test is right-tailed. The picture of the p-value is as follows:

TRY IT 2
H0: μ ≤ 1, Ha: μ > 1
Assume the p-value is 0.1243. What type of test is this? Draw the picture of the p-value.
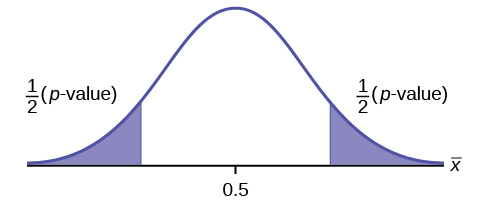
Example 3
H0: p = 50 Ha: p ≠ 50
This is a test of a single population mean. Ha tells you the test is two-tailed. The picture of the p-value is as follows:

TRY IT 3
H0: p = 0.5, Ha: p ≠ 0.5
Assume the p-value is 0.2564. What type of test is this? Draw the picture of the p-value.
Candela Citations
- Revision and Adaptation. Provided by: Lumen Learning. License: CC BY: Attribution
- Introductory Statistics. Authored by: Barbara Illowsky, Susan Dean. Provided by: OpenStax. Located at: https://openstax.org/books/introductory-statistics/pages/1-introduction. License: CC BY: Attribution. License Terms: Access for free at https://openstax.org/books/introductory-statistics/pages/1-introduction
- College Algebra. Authored by: Jay Abramson, et al.. Provided by: Lumen Learning. Located at: https://courses.lumenlearning.com/wm-developmentalemporium/chapter/read-describe-solutions-to-inequalities-2/. License: CC BY: Attribution
- Unit 10: Solving Equations and Inequalities, from Developmental Math: An Open Program. Provided by: Monterey Institute of Technology and Education. Located at: http://nrocnetwork.org/dm-opentext. License: CC BY: Attribution
