Learning Outcomes
- Calculate the population mean, variance and standard deviation
- Calculate the sample mean, variance and standard deviation
In Module 2 you learned formulas for numerical characteristics of populations and samples. The table below summarizes the formulas and notation for measures of center and spread.
| Population | Sample |
| Population size [latex]N[/latex] | Sample size [latex]n[/latex] |
| Population mean [latex]\mu = \frac{\sum{x}}{N}[/latex] | Sample mean [latex]\overline{x}=\frac{\sum{x}}{n}[/latex] |
| Population variance [latex]\sigma ^2. = \frac{\sum{(x- \mu)^2}}{N}[/latex] | Sample variance [latex]s^2=\frac{\sum{(x-\overline{x})^2}}{n-1}[/latex] |
| Population standard deviation [latex]\sigma = \sqrt{\frac{\sum{(x-\mu)^2}}{N}}[/latex] | Sample standard deviation [latex]s=\sqrt{\frac{\sum{(x-\overline{x})^2}}{n-1}}[/latex] |
The mean measures the “center” of a distribution. If you had to guess the value of a variable using a single number, your best guess for the value which comes closest to a randomly selected value might be the mean if the distribution is symmetric.
The variance and standard deviation measure the “spread” of values about the mean. The larger the variance and standard deviation are, the more spread out the values will be. Note that the standard deviation is always just the square root of the variance.
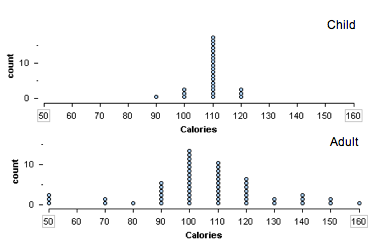
The dot plots below give calorie contents for children’s and adult’s cereal. We can see that the variance and standard deviation are greater for adult cereals since the observations are more spread out.
Example
Calculating a Population Mean, Variance, and Standard Deviation
Thanushka took five exams in his statistics class last semester. His scores are shown below.
[latex]89, 96, 97, 95, 98[/latex]
Calculate the mean, variance, and standard deviation.
Example
Calculating a Sample Mean, Variance, and Standard Deviation
A statistics professor took a random sample of five final exams from her statistics class last semester. The scores are shown below.
[latex]89, 96, 97, 95, 98[/latex]
Calculate the mean, variance, and standard deviation.
Try It
Try It
Candela Citations
- Provided by: Lumen Learning. License: CC BY: Attribution
- Concepts in Statistics. Provided by: Open Learning Initiative. Located at: http://oli.cmu.edu. License: CC BY: Attribution
- QID 7025, 7063. Authored by: Lippman, D. License: CC BY: Attribution. License Terms: IMathAS Community License CC-BY + GPL
