Learning Outcomes
- Draw a Venn diagram to represent a given scenario
- Use a Venn diagram to calculate probabilities
Venn Diagram
A Venn diagram is a picture that represents the outcomes of an experiment. It generally consists of a box that represents the sample space S together with circles or ovals. The circles or ovals represent events.
Example
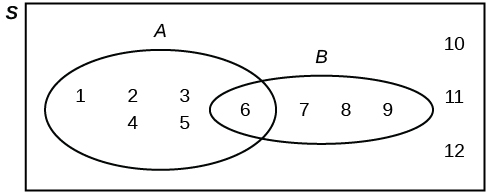
Suppose an experiment has the outcomes [latex]1, 2, 3, ... , 12[/latex] where each outcome has an equal chance of occurring. Let event [latex]A = \{1, 2, 3, 4, 5, 6\}[/latex] and event [latex]B = \{6, 7, 8, 9\}[/latex]. Then [latex]A \text{ AND } B = \{6\}[/latex] and [latex]A \text{ OR }B = \{1, 2, 3, 4, 5, 6, 7, 8, 9\}[/latex]. The Venn diagram is as follows:
Try It
Suppose an experiment has outcomes black, white, red, orange, yellow, green, blue, and purple, where each outcome has an equal chance of occurring. Let event C = {green, blue, purple} and event P = {red, yellow, blue}. Then C AND P = {blue} and C OR P = {green, blue, purple, red, yellow}. Draw a Venn diagram representing this situation.
Example
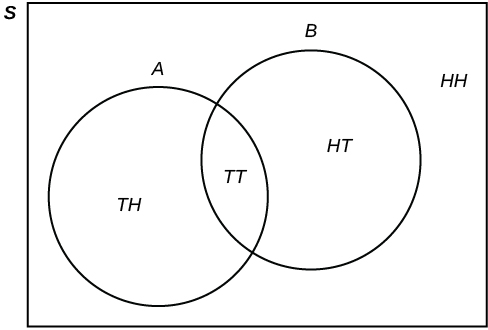
Flip two fair coins. Let [latex]A[/latex] = tails on the first coin. Let [latex]B[/latex] = tails on the second coin. Then [latex]A = \{TT, TH\}[/latex] and [latex]B = \{TT, HT\}[/latex]. Therefore,[latex]A \text{ AND } B = \{TT\}[/latex]. [latex]A \text{ OR } B = \{TH, TT, HT\}[/latex].
The sample space when you flip two fair coins is [latex]X = \{HH, HT, TH, TT\}[/latex]. The outcome [latex]HH[/latex] is in NEITHER [latex]A[/latex] NOR [latex]B[/latex]. The Venn diagram is as follows:
Try It
Roll a fair, six-sided die. Let A = a prime number of dots is rolled. Let B = an odd number of dots is rolled. Then A = {2, 3, 5} and B = {1, 3, 5}. Therefore, A AND B = {3, 5}. A OR B = {1, 2, 3, 5}. The sample space for rolling a fair die is S = {1, 2, 3, 4, 5, 6}. Draw a Venn diagram representing this situation.
Recall: Convert a Percent to a Decimal
- Write the percent as a ratio with the denominator 100.
- Convert the fraction to a decimal by dividing the numerator by the denominator.
Example
Forty percent of the students at a local college belong to a club and 50% work part time. Five percent of the students work part time and belong to a club. Draw a Venn diagram showing the relationships. Let C = student belongs to a club and PT = student works part time.
If a student is selected at random, find
- the probability that the student belongs to a club. P(C) = 0.40
- the probability that the student works part time. P(PT) = 0.50
- the probability that the student belongs to a club AND works part time. P(C AND PT) = 0.05
- the probability that the student belongs to a club given that the student works part time. [latex]P(C|PT)= \frac{P(C \ \mathrm{AND} \ PT)}{P(PT)} = \frac{0.05}{0.50} = 0.1[/latex]
- the probability that the student belongs to a club OR works part time. P(C OR PT) = P(C) + P(PT) – P(C AND PT) = 0.40 + 0.50 – 0.05 = 0.85
Try It
Fifty percent of the workers at a factory work a second job, 25% have a spouse who also works, 5% work a second job and have a spouse who also works. Draw a Venn diagram showing the relationships. Let W = works a second job and S = spouse also works.
Recall: The Mean
The mean of a set of n numbers is the arithmetic average of the numbers. It should be greater than the least number and less than the greatest number in the set.
[latex]\mathrm{Mean} = \frac{\mathrm{sum \ of \ values \ in \ the \ set}}{n}[/latex]
Example
A person with type O blood and a negative Rh factor (Rh-) can donate blood to any person with any blood type. Four percent of African Americans have type O blood and a negative RH factor, 5−10% of African Americans have the Rh- factor, and 51% have type O blood.

The “O” circle represents the African Americans with type O blood. The “Rh-“ oval represents the African Americans with the Rh- factor.
We will take the average of 5% and 10% and use 7.5% as the percent of African Americans who have the Rh- factor. Let O = African American with Type O blood and R = African American with Rh- factor.
- P(O) = ___________
- P(R) = ___________
- P(O AND R) = ___________
- P(O OR R) = ____________
- In the Venn Diagram, describe the overlapping area using a complete sentence.
- In the Venn Diagram, describe the area in the rectangle but outside both the circle and the oval using a complete sentence.
Try It
In a bookstore, the probability that the customer buys a novel is 0.6, and the probability that the customer buys a non-fiction book is 0.4. Suppose that the probability that the customer buys both is 0.2.
- Draw a Venn diagram representing the situation.
- Find the probability that the customer buys either a novel or a non-fiction book.
- In the Venn diagram, describe the overlapping area using a complete sentence.
- Suppose that some customers buy only compact disks. Draw an oval in your Venn diagram representing this event.
Candela Citations
- Statistics, Tree and Venn Diagrams. Provided by: OpenStax. Located at: https://openstax.org/books/statistics/pages/3-5-tree-and-venn-diagrams. License: CC BY: Attribution. License Terms: Access for free at https://openstax.org/books/statistics/pages/1-introduction
- Introductory Statistics. Authored by: Barbara Illowsky, Susan Dean. Provided by: Open Stax. Located at: https://openstax.org/books/introductory-statistics/pages/1-introduction. License: CC BY: Attribution. License Terms: Access for free at https://openstax.org/books/introductory-statistics/pages/1-introduction
- Prealgebra. Provided by: Open Stax. Located at: https://openstax.org/books/prealgebra/pages/1-introduction. License: CC BY: Attribution. License Terms: Access for free at https://openstax.org/books/prealgebra/pages/1-introduction
- Solving Problems with Venn Diagrams. Authored by: Mathispower4u. Located at: https://youtu.be/MassxXy8iko. License: All Rights Reserved. License Terms: Standard YouTube License
