There are many real-world scenarios that involve finding the maximum or minimum value of a quadratic function, such as applications involving area and revenue.
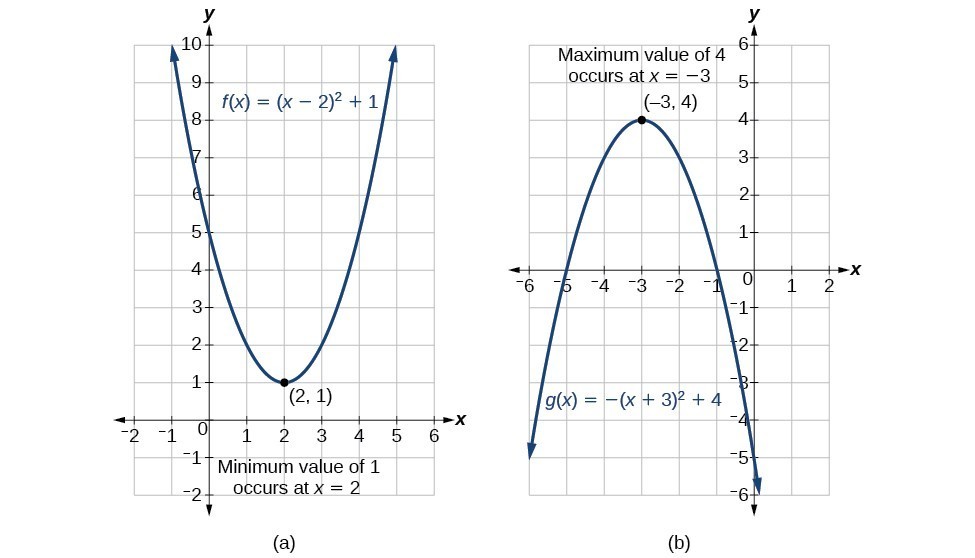
Figure 9
Example 5: Finding the Maximum Value of a Quadratic Function
A backyard farmer wants to enclose a rectangular space for a new garden within her fenced backyard. She has purchased 80 feet of wire fencing to enclose three sides, and she will use a section of the backyard fence as the fourth side.
- Find a formula for the area enclosed by the fence if the sides of fencing perpendicular to the existing fence have length L.
- What dimensions should she make her garden to maximize the enclosed area?
Solution
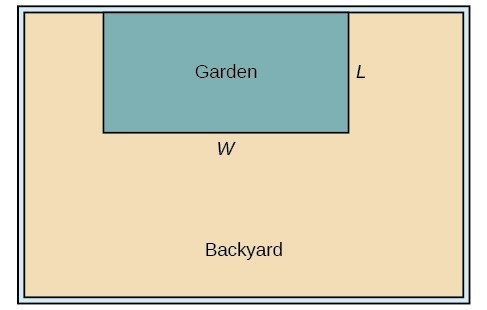
Figure 10
Let’s use a diagram such as the one in Figure 10 to record the given information. It is also helpful to introduce a temporary variable, W, to represent the width of the garden and the length of the fence section parallel to the backyard fence.
- We know we have only 80 feet of fence available, and [latex]L+W+L=80,[/latex] or more simply, [latex]2L+W=80.[/latex] This allows us to represent the width, W, in terms of L.
[latex]W=80 - 2L[/latex]
Now we are ready to write an equation for the area the fence encloses. We know the area of a rectangle is length multiplied by width, so
[latex]\begin{cases}\text{ }A=LW=L\left(80 - 2L\right)\hfill \\ A\left(L\right)=80L - 2{L}^{2}\hfill \end{cases}[/latex]This formula represents the area of the fence in terms of the variable length L. The function, written in general form, is
[latex]A\left(L\right)=-2{L}^{2}+80L.[/latex] - The quadratic has a negative leading coefficient, so the graph will open downward, and the vertex will be the maximum value for the area. In finding the vertex, we must be careful because the equation is not written in standard polynomial form with decreasing powers. This is why we rewrote the function in general form above. Since a is the coefficient of the squared term, [latex]a=-2,b=80,[/latex] and [latex]c=0.[/latex]
To find the vertex:
The maximum value of the function is an area of 800 square feet, which occurs when [latex]L=20[/latex] feet. When the shorter sides are 20 feet, there is 40 feet of fencing left for the longer side. To maximize the area, she should enclose the garden so the two shorter sides have length 20 feet and the longer side parallel to the existing fence has length 40 feet.
How To: Given an application involving revenue, use a quadratic equation to find the maximum.
- Write a quadratic equation for revenue.
- Find the vertex of the quadratic equation.
- Determine the y-value of the vertex.
Example 6: Finding Maximum Revenue
The unit price of an item affects its supply and demand. That is, if the unit price goes up, the demand for the item will usually decrease. For example, a local newspaper currently has 84,000 subscribers at a quarterly charge of $30. Market research has suggested that if the owners raise the price to $32, they would lose 5,000 subscribers. Assuming that subscriptions are linearly related to the price, what price should the newspaper charge for a quarterly subscription to maximize their revenue?
Solution
Revenue is the amount of money a company brings in. In this case, the revenue can be found by multiplying the price per subscription times the number of subscribers, or quantity. We can introduce variables, p for price per subscription and Q for quantity, giving us the equation [latex]\text{Revenue}=pQ.[/latex]
Because the number of subscribers changes with the price, we need to find a relationship between the variables. We know that currently [latex]p=30[/latex] and [latex]Q=84,000.[/latex] We also know that if the price rises to $32, the newspaper would lose 5,000 subscribers, giving a second pair of values, [latex]p=32[/latex] and [latex]Q=79,000.[/latex] From this we can find a linear equation relating the two quantities. The slope will be
This tells us the paper will lose 2,500 subscribers for each dollar they raise the price. We can then solve for the y-intercept.
This gives us the linear equation [latex]Q=-2,500p+159,000[/latex] relating cost and subscribers. We now return to our revenue equation.
We now have a quadratic function for revenue as a function of the subscription charge. To find the price that will maximize revenue for the newspaper, we can find the vertex.
The model tells us that the maximum revenue will occur if the newspaper charges $31.80 for a subscription. To find what the maximum revenue is, we evaluate the revenue function.
Analysis of the Solution
This could also be solved by graphing the quadratic. We can see the maximum revenue on a graph of the quadratic function.
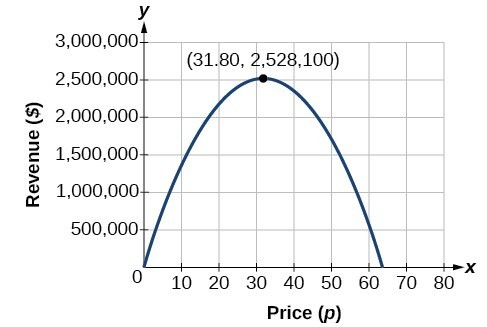
Figure 12
Finding the x– and y-Intercepts of a Quadratic Function
Much as we did in the application problems above, we also need to find intercepts of quadratic equations for graphing parabolas. Recall that we find the y-intercept of a quadratic by evaluating the function at an input of zero, and we find the x-intercepts at locations where the output is zero. Notice that the number of x-intercepts can vary depending upon the location of the graph.
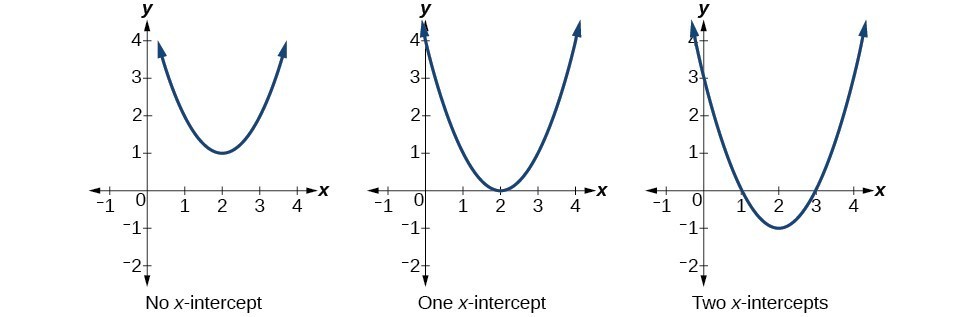
Figure 13. Number of x-intercepts of a parabola
How To: Given a quadratic function [latex]f\left(x\right),[/latex] find the y– and x-intercepts.
- Evaluate [latex]f\left(0\right)[/latex] to find the y-intercept.
- Solve the quadratic equation [latex]f\left(x\right)=0[/latex] to find the x-intercepts.
Example 7: Finding the y– and x-Intercepts of a Parabola
Find the y– and x-intercepts of the quadratic [latex]f\left(x\right)=3{x}^{2}+5x - 2.[/latex]
Solution
We find the y-intercept by evaluating [latex]f\left(0\right).[/latex]
So the y-intercept is at [latex]\left(0,-2\right).[/latex]
For the x-intercepts, we find all solutions of [latex]f\left(x\right)=0.[/latex]
In this case, the quadratic can be factored easily, providing the simplest method for solution.
So the x-intercepts are at [latex]\left(\frac{1}{3},0\right)[/latex] and [latex]\left(-2,0\right).[/latex]
Analysis of the Solution
By graphing the function, we can confirm that the graph crosses the y-axis at [latex]\left(0,-2\right).[/latex] We can also confirm that the graph crosses the x-axis at [latex]\left(\frac{1}{3},0\right)[/latex] and [latex]\left(-2,0\right).[/latex]
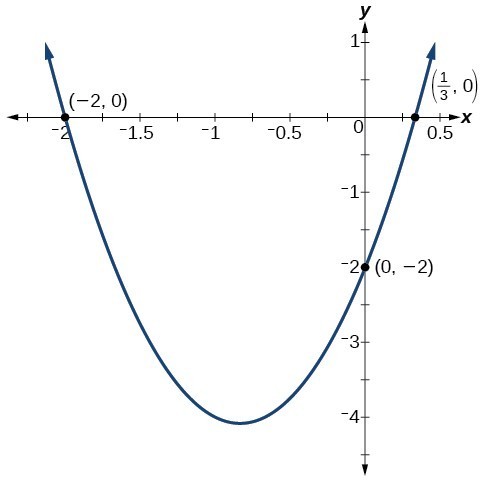
Figure 14
Candela Citations
- Precalculus. Authored by: Jay Abramson, et al.. Provided by: OpenStax. Located at: http://cnx.org/contents/fd53eae1-fa23-47c7-bb1b-972349835c3c@5.175. License: CC BY: Attribution. License Terms: Download For Free at : http://cnx.org/contents/fd53eae1-fa23-47c7-bb1b-972349835c3c@5.175.
Analysis of the Solution
This problem also could be solved by graphing the quadratic function. We can see where the maximum area occurs on a graph of the quadratic function in Figure 11.
Figure 11