Figure 4
The linear functions we used in the two previous examples increased over time, but not every linear function does. A linear function may be increasing, decreasing, or constant.
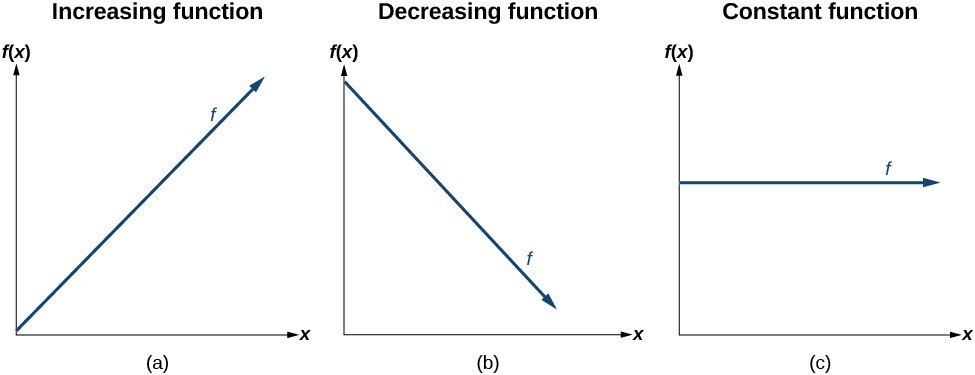
For an increasing function, as with the train example,
the output values increase as the input values increase.
The graph of an increasing function has a positive slope. A line with a positive slope slants upward from left to right as in (a).
For a decreasing function, the slope is negative.
The output values decrease as the input values increase.
A line with a negative slope slants downward from left to right as in (b). If the function is constant, the output values are the same for all input values so the slope is zero. A line with a slope of zero is horizontal as in (c).
A General Note: Increasing and Decreasing Functions
The slope determines if the function is an increasing linear function, a decreasing linear function, or a constant function.
- [latex]f\left(x\right)=mx+b\text{ is an increasing function if }m>0[/latex].
- [latex]f\left(x\right)=mx+b\text{ is an decreasing function if }m<0[/latex].
- [latex]f\left(x\right)=mx+b\text{ is a constant function if }m=0[/latex].
Example 2: Deciding whether a Function Is Increasing, Decreasing, or Constant
Some recent studies suggest that a teenager sends an average of 60 texts per day.[1] For each of the following scenarios, find the linear function that describes the relationship between the input value and the output value. Then, determine whether the graph of the function is increasing, decreasing, or constant.
- The total number of texts a teen sends is considered a function of time in days. The input is the number of days, and output is the total number of texts sent.
- A teen has a limit of 500 texts per month in his or her data plan. The input is the number of days, and output is the total number of texts remaining for the month.
- A teen has an unlimited number of texts in his or her data plan for a cost of $50 per month. The input is the number of days, and output is the total cost of texting each month.
Solution
Analyze each function.
- The function can be represented as [latex]f\left(x\right)=60x[/latex] where [latex]x[/latex] is the number of days. The slope, 60, is positive so the function is increasing. This makes sense because the total number of texts increases with each day.
- The function can be represented as [latex]f\left(x\right)=500 - 60x[/latex] where [latex]x[/latex] is the number of days. In this case, the slope is negative so the function is decreasing. This makes sense because the number of texts remaining decreases each day and this function represents the number of texts remaining in the data plan after [latex]x[/latex] days.
- The cost function can be represented as [latex]f\left(x\right)=50[/latex] because the number of days does not affect the total cost. The slope is 0 so the function is constant.
Candela Citations
- Precalculus. Authored by: Jay Abramson, et al.. Provided by: OpenStax. Located at: http://cnx.org/contents/fd53eae1-fa23-47c7-bb1b-972349835c3c@5.175. License: CC BY: Attribution. License Terms: Download For Free at : http://cnx.org/contents/fd53eae1-fa23-47c7-bb1b-972349835c3c@5.175.