Another way to identify the domain and range of functions is by using graphs. Because the domain refers to the set of possible input values, the domain of a graph consists of all the input values shown on the x-axis. The range is the set of possible output values, which are shown on the y-axis. Keep in mind that if the graph continues beyond the portion of the graph we can see, the domain and range may be greater than the visible values. See Figure 6.
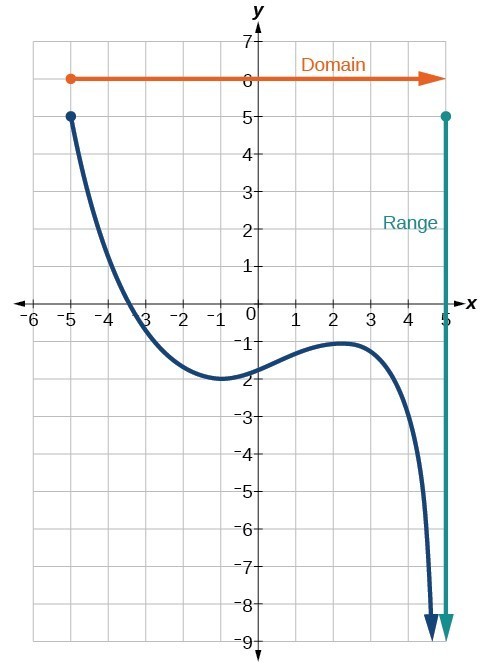
Figure 6
We can observe that the graph extends horizontally from [latex]-5[/latex] to the right without bound, so the domain is [latex]\left[-5,\infty \right)[/latex]. The vertical extent of the graph is all range values [latex]5[/latex] and below, so the range is [latex]\left(\mathrm{-\infty },5\right][/latex]. Note that the domain and range are always written from smaller to larger values, or from left to right for domain, and from the bottom of the graph to the top of the graph for range.
Example 6: Finding Domain and Range from a Graph
Find the domain and range of the function [latex]f[/latex] whose graph is shown in Figure 7.
![Graph of a function from (-3, 1].](https://s3-us-west-2.amazonaws.com/courses-images-archive-read-only/wp-content/uploads/sites/924/2015/11/25200624/CNX_Precalc_Figure_01_02_0072.jpg)
Figure 7
Solution
We can observe that the horizontal extent of the graph is –3 to 1, so the domain of [latex]f[/latex] is [latex]\left(-3,1\right][/latex].
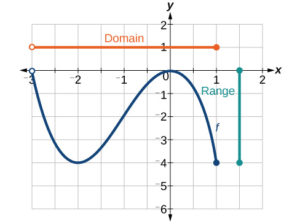
Figure 8
The vertical extent of the graph is 0 to –4, so the range is [latex]\left[-4,0\right][/latex].
Example 7: Finding Domain and Range from a Graph of Oil Production
Find the domain and range of the function [latex]f[/latex] whose graph is shown in Figure 9.
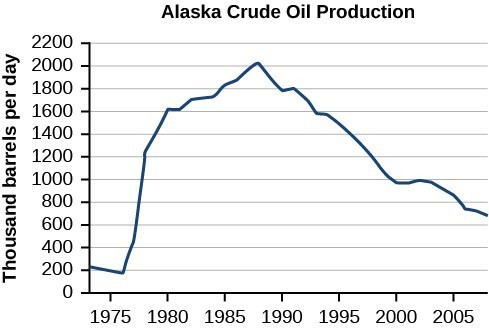
Figure 9. (credit: modification of work by the U.S. Energy Information Administration)
Solution
The input quantity along the horizontal axis is “years,” which we represent with the variable [latex]t[/latex] for time. The output quantity is “thousands of barrels of oil per day,” which we represent with the variable [latex]b[/latex] for barrels. The graph may continue to the left and right beyond what is viewed, but based on the portion of the graph that is visible, we can determine the domain as [latex]1973\le t\le 2008[/latex] and the range as approximately [latex]180\le b\le 2010[/latex].
In interval notation, the domain is [1973, 2008], and the range is about [180, 2010]. For the domain and the range, we approximate the smallest and largest values since they do not fall exactly on the grid lines.
Try It 6
Given the graph in Figure 10, identify the domain and range using interval notation.
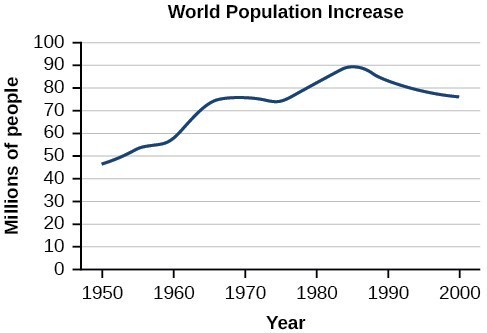
Figure 10
Q & A
Can a function’s domain and range be the same?
Yes. For example, the domain and range of the cube root function are both the set of all real numbers.
Candela Citations
- Precalculus. Authored by: Jay Abramson, et al.. Provided by: OpenStax. Located at: https://cnx.org/contents/_VPq4foj@10.134:vEOnJry_@5/Introduction-to-Functions. License: CC BY: Attribution. License Terms: Download For Free at : http://cnx.org/contents/fd53eae1-fa23-47c7-bb1b-972349835c3c@5.175.
- Ex 1: Determine the Domain and Range of the Graph of a Function. Authored by: Mathispower4u. Located at: https://www.youtube.com/watch?v=QAxZEelInJc. License: All Rights Reserved. License Terms: Standard YouTube LIcense