When we have an equation in standard form for a hyperbola centered at the origin, we can interpret its parts to identify the key features of its graph: the center, vertices, co-vertices, asymptotes, foci, and lengths and positions of the transverse and conjugate axes. To graph hyperbolas centered at the origin, we use the standard form [latex]\frac{{x}^{2}}{{a}^{2}}-\frac{{y}^{2}}{{b}^{2}}=1[/latex] for horizontal hyperbolas and the standard form [latex]\frac{{y}^{2}}{{a}^{2}}-\frac{{x}^{2}}{{b}^{2}}=1[/latex] for vertical hyperbolas.
How To: Given a standard form equation for a hyperbola centered at [latex]\left(0,0\right)[/latex], sketch the graph.
- Determine which of the standard forms applies to the given equation.
- Use the standard form identified in Step 1 to determine the position of the transverse axis; coordinates for the vertices, co-vertices, and foci; and the equations for the asymptotes.
- If the equation is in the form [latex]\frac{{x}^{2}}{{a}^{2}}-\frac{{y}^{2}}{{b}^{2}}=1[/latex], then
- the transverse axis is on the x-axis
- the coordinates of the vertices are [latex]\left(\pm a,0\right)[/latex]
- the coordinates of the co-vertices are [latex]\left(0,\pm b\right)[/latex]
- the coordinates of the foci are [latex]\left(\pm c,0\right)[/latex]
- the equations of the asymptotes are [latex]y=\pm \frac{b}{a}x[/latex]
- If the equation is in the form [latex]\frac{{y}^{2}}{{a}^{2}}-\frac{{x}^{2}}{{b}^{2}}=1[/latex], then
- the transverse axis is on the y-axis
- the coordinates of the vertices are [latex]\left(0,\pm a\right)[/latex]
- the coordinates of the co-vertices are [latex]\left(\pm b,0\right)[/latex]
- the coordinates of the foci are [latex]\left(0,\pm c\right)[/latex]
- the equations of the asymptotes are [latex]y=\pm \frac{a}{b}x[/latex]
- If the equation is in the form [latex]\frac{{x}^{2}}{{a}^{2}}-\frac{{y}^{2}}{{b}^{2}}=1[/latex], then
- Solve for the coordinates of the foci using the equation [latex]c=\pm \sqrt{{a}^{2}+{b}^{2}}[/latex].
- Plot the vertices, co-vertices, foci, and asymptotes in the coordinate plane, and draw a smooth curve to form the hyperbola.
Example 4: Graphing a Hyperbola Centered at (0, 0) Given an Equation in Standard Form
Graph the hyperbola given by the equation [latex]\frac{{y}^{2}}{64}-\frac{{x}^{2}}{36}=1[/latex]. Identify and label the vertices, co-vertices, foci, and asymptotes.
Solution
The standard form that applies to the given equation is [latex]\frac{{y}^{2}}{{a}^{2}}-\frac{{x}^{2}}{{b}^{2}}=1[/latex]. Thus, the transverse axis is on the y-axis
The coordinates of the vertices are [latex]\left(0,\pm a\right)=\left(0,\pm \sqrt{64}\right)=\left(0,\pm 8\right)[/latex]
The coordinates of the co-vertices are [latex]\left(\pm b,0\right)=\left(\pm \sqrt{36},\text{ }0\right)=\left(\pm 6,0\right)[/latex]
The coordinates of the foci are [latex]\left(0,\pm c\right)[/latex], where [latex]c=\pm \sqrt{{a}^{2}+{b}^{2}}[/latex]. Solving for [latex]c[/latex], we have
Therefore, the coordinates of the foci are [latex]\left(0,\pm 10\right)[/latex]
The equations of the asymptotes are [latex]y=\pm \frac{a}{b}x=\pm \frac{8}{6}x=\pm \frac{4}{3}x[/latex]
Plot and label the vertices and co-vertices, and then sketch the central rectangle. Sides of the rectangle are parallel to the axes and pass through the vertices and co-vertices. Sketch and extend the diagonals of the central rectangle to show the asymptotes. The central rectangle and asymptotes provide the framework needed to sketch an accurate graph of the hyperbola. Label the foci and asymptotes, and draw a smooth curve to form the hyperbola, as shown in Figure 8.
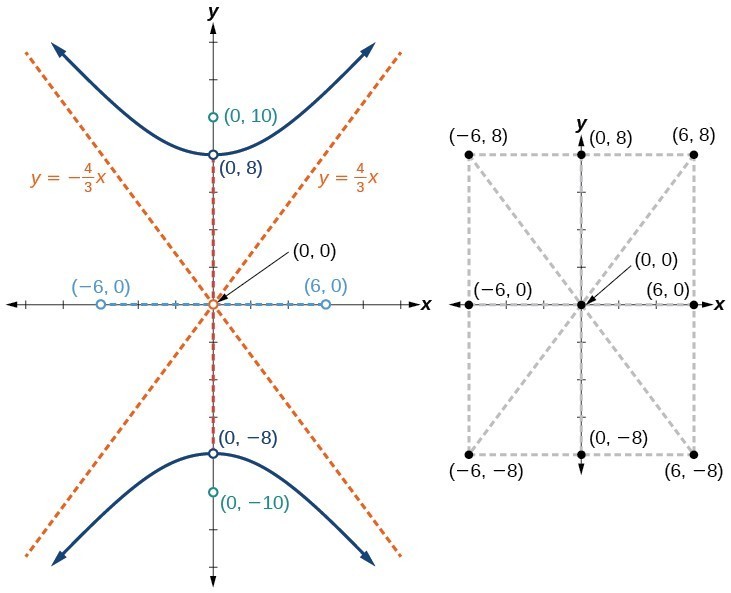
Figure 8
Try It 4
Graph the hyperbola given by the equation [latex]\frac{{x}^{2}}{144}-\frac{{y}^{2}}{81}=1[/latex]. Identify and label the vertices, co-vertices, foci, and asymptotes.
Graphing Hyperbolas Not Centered at the Origin
Graphing hyperbolas centered at a point [latex]\left(h,k\right)[/latex] other than the origin is similar to graphing ellipses centered at a point other than the origin. We use the standard forms [latex]\frac{{\left(x-h\right)}^{2}}{{a}^{2}}-\frac{{\left(y-k\right)}^{2}}{{b}^{2}}=1[/latex] for horizontal hyperbolas, and [latex]\frac{{\left(y-k\right)}^{2}}{{a}^{2}}-\frac{{\left(x-h\right)}^{2}}{{b}^{2}}=1[/latex] for vertical hyperbolas. From these standard form equations we can easily calculate and plot key features of the graph: the coordinates of its center, vertices, co-vertices, and foci; the equations of its asymptotes; and the positions of the transverse and conjugate axes.
How To: Given a general form for a hyperbola centered at [latex]\left(h,k\right)[/latex], sketch the graph.
- Convert the general form to that standard form. Determine which of the standard forms applies to the given equation.
- Use the standard form identified in Step 1 to determine the position of the transverse axis; coordinates for the center, vertices, co-vertices, foci; and equations for the asymptotes.
- If the equation is in the form [latex]\frac{{\left(x-h\right)}^{2}}{{a}^{2}}-\frac{{\left(y-k\right)}^{2}}{{b}^{2}}=1[/latex], then
- the transverse axis is parallel to the x-axis
- the center is [latex]\left(h,k\right)[/latex]
- the coordinates of the vertices are [latex]\left(h\pm a,k\right)[/latex]
- the coordinates of the co-vertices are [latex]\left(h,k\pm b\right)[/latex]
- the coordinates of the foci are [latex]\left(h\pm c,k\right)[/latex]
- the equations of the asymptotes are [latex]y=\pm \frac{b}{a}\left(x-h\right)+k[/latex]
- If the equation is in the form [latex]\frac{{\left(y-k\right)}^{2}}{{a}^{2}}-\frac{{\left(x-h\right)}^{2}}{{b}^{2}}=1[/latex], then
- the transverse axis is parallel to the y-axis
- the center is [latex]\left(h,k\right)[/latex]
- the coordinates of the vertices are [latex]\left(h,k\pm a\right)[/latex]
- the coordinates of the co-vertices are [latex]\left(h\pm b,k\right)[/latex]
- the coordinates of the foci are [latex]\left(h,k\pm c\right)[/latex]
- the equations of the asymptotes are [latex]y=\pm \frac{a}{b}\left(x-h\right)+k[/latex]
- If the equation is in the form [latex]\frac{{\left(x-h\right)}^{2}}{{a}^{2}}-\frac{{\left(y-k\right)}^{2}}{{b}^{2}}=1[/latex], then
- Solve for the coordinates of the foci using the equation [latex]c=\pm \sqrt{{a}^{2}+{b}^{2}}[/latex].
- Plot the center, vertices, co-vertices, foci, and asymptotes in the coordinate plane and draw a smooth curve to form the hyperbola.
Example 5: Graphing a Hyperbola Centered at (h, k) Given an Equation in General Form
Graph the hyperbola given by the equation [latex]9{x}^{2}-4{y}^{2}-36x - 40y - 388=0[/latex]. Identify and label the center, vertices, co-vertices, foci, and asymptotes.
Solution
Start by expressing the equation in standard form. Group terms that contain the same variable, and move the constant to the opposite side of the equation.
Factor the leading coefficient of each expression.
Complete the square twice. Remember to balance the equation by adding the same constants to each side.
Rewrite as perfect squares.
Divide both sides by the constant term to place the equation in standard form.
The standard form that applies to the given equation is [latex]\frac{{\left(x-h\right)}^{2}}{{a}^{2}}-\frac{{\left(y-k\right)}^{2}}{{b}^{2}}=1[/latex], where [latex]{a}^{2}=36[/latex] and [latex]{b}^{2}=81[/latex], or [latex]a=6[/latex] and [latex]b=9[/latex]. Thus, the transverse axis is parallel to the x-axis. It follows that:
- the center of the ellipse is [latex]\left(h,k\right)=\left(2,-5\right)[/latex]
- the coordinates of the vertices are [latex]\left(h\pm a,k\right)=\left(2\pm 6,-5\right)[/latex], or [latex]\left(-4,-5\right)[/latex] and [latex]\left(8,-5\right)[/latex]
- the coordinates of the co-vertices are [latex]\left(h,k\pm b\right)=\left(2,-5\pm 9\right)[/latex], or [latex]\left(2,-14\right)[/latex] and [latex]\left(2,4\right)[/latex]
- the coordinates of the foci are [latex]\left(h\pm c,k\right)[/latex], where [latex]c=\pm \sqrt{{a}^{2}+{b}^{2}}[/latex]. Solving for [latex]c[/latex], we have
Therefore, the coordinates of the foci are [latex]\left(2 - 3\sqrt{13},-5\right)[/latex] and [latex]\left(2+3\sqrt{13},-5\right)[/latex].
The equations of the asymptotes are [latex]y=\pm \frac{b}{a}\left(x-h\right)+k=\pm \frac{3}{2}\left(x - 2\right)-5[/latex].
Next, we plot and label the center, vertices, co-vertices, foci, and asymptotes and draw smooth curves to form the hyperbola.
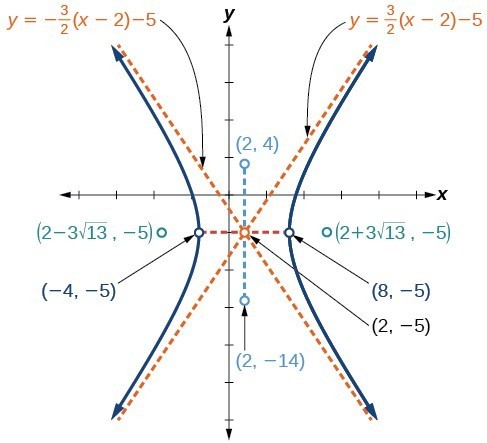
Figure 9
Try It 5
Graph the hyperbola given by the standard form of an equation [latex]\frac{{\left(y+4\right)}^{2}}{100}-\frac{{\left(x - 3\right)}^{2}}{64}=1[/latex]. Identify and label the center, vertices, co-vertices, foci, and asymptotes.
Candela Citations
- Precalculus. Authored by: OpenStax College. Provided by: OpenStax. Located at: http://cnx.org/contents/fd53eae1-fa23-47c7-bb1b-972349835c3c@5.175:1/Preface. License: CC BY: Attribution