All of the equations in the systems that we have encountered so far have involved equalities, but we may also encounter systems that involve inequalities. We have already learned to graph linear inequalities by graphing the corresponding equation, and then shading the region represented by the inequality symbol. Now, we will follow similar steps to graph a nonlinear inequality so that we can learn to solve systems of nonlinear inequalities. A nonlinear inequality is an inequality containing a nonlinear expression. Graphing a nonlinear inequality is much like graphing a linear inequality.
Recall that when the inequality is greater than, [latex]y>a[/latex], or less than, [latex]y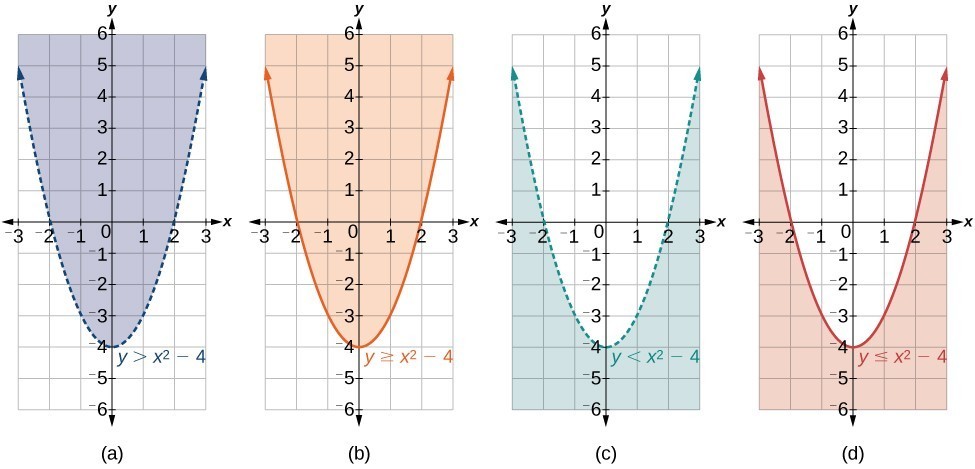
Figure 8. (a) an example of [latex]y>a[/latex]; (b) an example of [latex]y\ge a[/latex]; (c) an example of [latex]y<a[/latex]; (d) an example of [latex]y\le a[/latex]
How To: Given an inequality bounded by a parabola, sketch a graph.
- Graph the parabola as if it were an equation. This is the boundary for the region that is the solution set.
- If the boundary is included in the region (the operator is [latex]\le[/latex] or [latex]\ge[/latex] ), the parabola is graphed as a solid line.
- If the boundary is not included in the region (the operator is < or >), the parabola is graphed as a dashed line.
- Test a point in one of the regions to determine whether it satisfies the inequality statement. If the statement is true, the solution set is the region including the point. If the statement is false, the solution set is the region on the other side of the boundary line.
- Shade the region representing the solution set.
Example 4: Graphing an Inequality for a Parabola
Graph the inequality [latex]y>{x}^{2}+1[/latex].
Solution
First, graph the corresponding equation [latex]y={x}^{2}+1[/latex]. Since [latex]y>{x}^{2}+1[/latex] has a greater than symbol, we draw the graph with a dashed line. Then we choose points to test both inside and outside the parabola. Let’s test the points [latex]\left(0,2\right)[/latex] and [latex]\left(2,0\right)[/latex]. One point is clearly inside the parabola and the other point is clearly outside.
[latex]\begin{array}{ll}y>{x}^{2}+1\hfill & \hfill \\ 2>{\left(0\right)}^{2}+1\hfill & \hfill \\ 2>1\hfill & \text{True}\hfill \\ \hfill & \hfill \\ \hfill & \hfill \\ \hfill & \hfill \\ 0>{\left(2\right)}^{2}+1\hfill & \hfill \\ 0>5\hfill & \text{False}\hfill \end{array}[/latex]
The graph is shown in Figure 9. We can see that the solution set consists of all points inside the parabola, but not on the graph itself.
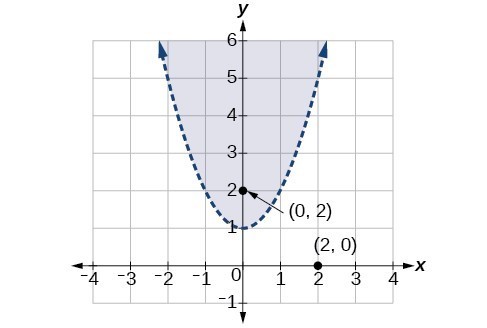
Figure 9
Graphing a System of Nonlinear Inequalities
Now that we have learned to graph nonlinear inequalities, we can learn how to graph systems of nonlinear inequalities. A system of nonlinear inequalities is a system of two or more inequalities in two or more variables containing at least one inequality that is not linear. Graphing a system of nonlinear inequalities is similar to graphing a system of linear inequalities. The difference is that our graph may result in more shaded regions that represent a solution than we find in a system of linear inequalities. The solution to a nonlinear system of inequalities is the region of the graph where the shaded regions of the graph of each inequality overlap, or where the regions intersect, called the feasible region.
How To: Given a system of nonlinear inequalities, sketch a graph.
- Find the intersection points by solving the corresponding system of nonlinear equations.
- Graph the nonlinear equations.
- Find the shaded regions of each inequality.
- Identify the feasible region as the intersection of the shaded regions of each inequality or the set of points common to each inequality.
Example 5: Graphing a System of Inequalities
Graph the given system of inequalities.
[latex]\begin{array}{r}\hfill {x}^{2}-y\le 0\\ \hfill 2{x}^{2}+y\le 12\end{array}[/latex]
Solution
These two equations are clearly parabolas. We can find the points of intersection by the elimination process: Add both equations and the variable [latex]y[/latex] will be eliminated. Then we solve for [latex]x[/latex].
[latex]\begin{array}\hfill x^{2}−y=0 \\ 2x^{2}+y=12 \\ \text{___________} \\ 3x^{2}=12 \\ x^{2}=4 \\ x=\pm 2\end{array}[/latex]
Substitute the x-values into one of the equations and solve for [latex]y[/latex].
[latex]\begin{array}{r}\hfill {x}^{2}-y=0\\ \hfill {\left(2\right)}^{2}-y=0\\ \hfill 4-y=0\\ \hfill y=4\\ \hfill \\ \hfill {\left(-2\right)}^{2}-y=0\\ \hfill 4-y=0\\ \hfill y=4\end{array}[/latex]
The two points of intersection are [latex]\left(2,4\right)[/latex] and [latex]\left(-2,4\right)[/latex]. Notice that the equations can be rewritten as follows.
[latex]\begin{array}{l}{x}^{2}-y\le 0\hfill \\ {x}^{2}\le y\hfill \\ y\ge {x}^{2}\hfill \\ \hfill \\ 2{x}^{2}+y\le 12\hfill \\ y\le -2{x}^{2}+12\hfill \end{array}[/latex]
Graph each inequality. The feasible region is the region between the two equations bounded by [latex]2{x}^{2}+y\le 12[/latex] on the top and [latex]{x}^{2}-y\le 0[/latex] on the bottom.
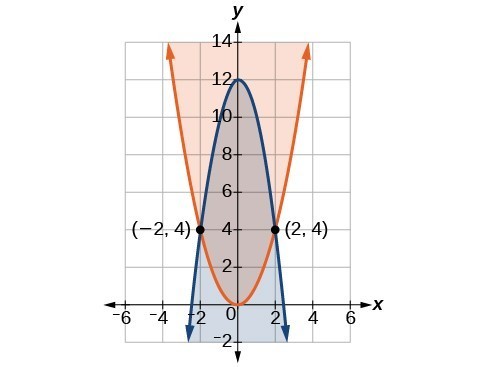
Figure 10
Try It 4
Graph the given system of inequalities.
[latex]\begin{array}{l}\text{ }y\ge {x}^{2}-1\hfill \\ x-y\ge -1\hfill \end{array}[/latex]
Solution
Candela Citations
CC licensed content, Specific attribution