In The Ellipse, we saw that an ellipse is formed when a plane cuts through a right circular cone. If the plane is parallel to the edge of the cone, an unbounded curve is formed. This curve is a parabola.
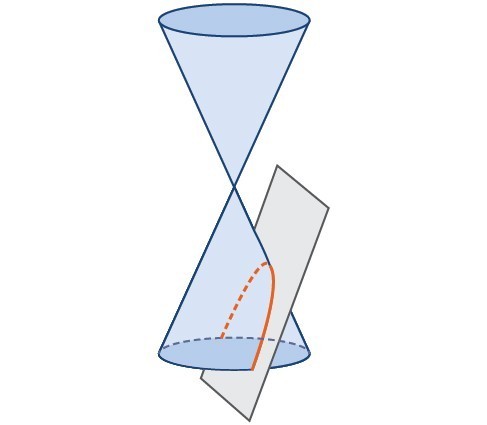
Figure 2. Parabola
Like the ellipse and hyperbola, the parabola can also be defined by a set of points in the coordinate plane. A parabola is the set of all points [latex]\left(x,y\right)[/latex] in a plane that are the same distance from a fixed line, called the directrix, and a fixed point (the focus) not on the directrix.
We previously learned about a parabola’s vertex and axis of symmetry. Now we extend the discussion to include other key features of the parabola. See Figure 3. Notice that the axis of symmetry passes through the focus and vertex and is perpendicular to the directrix. The vertex is the midpoint between the directrix and the focus.
The line segment that passes through the focus and is parallel to the directrix is called the latus rectum. The endpoints of the latus rectum lie on the curve. By definition, the distance [latex]d[/latex] from the focus to any point [latex]P[/latex] on the parabola is equal to the distance from [latex]P[/latex] to the directrix.
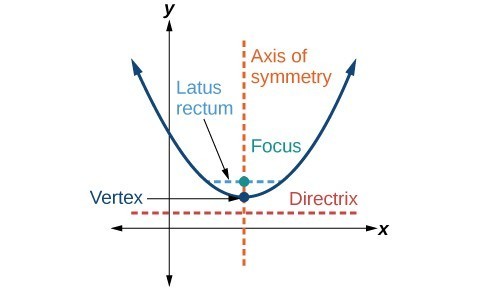
Figure 3. Key features of the parabola
To work with parabolas in the coordinate plane, we consider two cases: those with a vertex at the origin and those with a vertex at a point other than the origin. We begin with the former.
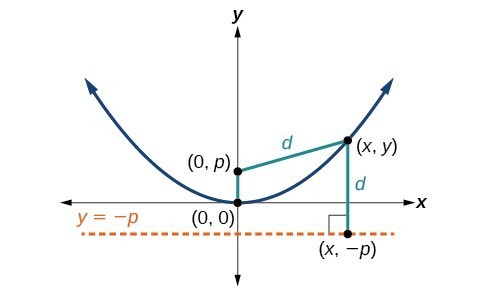
Figure 4
Let [latex]\left(x,y\right)[/latex] be a point on the parabola with vertex [latex]\left(0,0\right)[/latex], focus [latex]\left(0,p\right)[/latex], and directrix [latex]y= -p[/latex] as shown in Figure 4. The distance [latex]d[/latex] from point [latex]\left(x,y\right)[/latex] to point [latex]\left(x,-p\right)[/latex] on the directrix is the difference of the y-values: [latex]d=y+p[/latex]. The distance from the focus [latex]\left(0,p\right)[/latex] to the point [latex]\left(x,y\right)[/latex] is also equal to [latex]d[/latex] and can be expressed using the distance formula.
Set the two expressions for [latex]d[/latex] equal to each other and solve for [latex]y[/latex] to derive the equation of the parabola. We do this because the distance from [latex]\left(x,y\right)[/latex] to [latex]\left(0,p\right)[/latex] equals the distance from [latex]\left(x,y\right)[/latex] to [latex]\left(x, -p\right)[/latex].
We then square both sides of the equation, expand the squared terms, and simplify by combining like terms.
The equations of parabolas with vertex [latex]\left(0,0\right)[/latex] are [latex]{y}^{2}=4px[/latex] when the x-axis is the axis of symmetry and [latex]{x}^{2}=4py[/latex] when the y-axis is the axis of symmetry. These standard forms are given below, along with their general graphs and key features.
A General Note: Standard Forms of Parabolas with Vertex (0, 0)
The table below and Figure 5 summarize the standard features of parabolas with a vertex at the origin.
| Axis of Symmetry | Equation | Focus | Directrix | Endpoints of Latus Rectum |
| x-axis | [latex]{y}^{2}=4px[/latex] | [latex]\left(p,\text{ }0\right)[/latex] | [latex]x=-p[/latex] | [latex]\left(p,\text{ }\pm 2p\right)[/latex] |
| y-axis | [latex]{x}^{2}=4py[/latex] | [latex]\left(0,\text{ }p\right)[/latex] | [latex]y=-p[/latex] | [latex]\left(\pm 2p,\text{ }p\right)[/latex] |
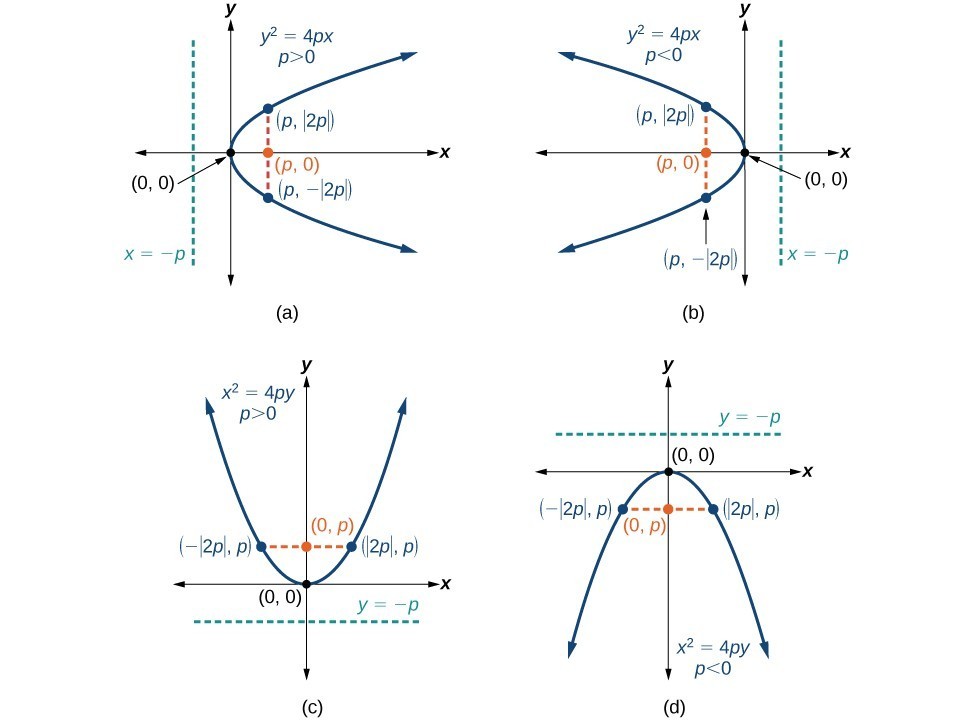
Figure 5. (a) When [latex]p>0[/latex] and the axis of symmetry is the x-axis, the parabola opens right. (b) When [latex]p<0[/latex] and the axis of symmetry is the x-axis, the parabola opens left. (c) When [latex]p<0[/latex] and the axis of symmetry is the y-axis, the parabola opens up. (d) When [latex]\text{ }p<0\text{ }[/latex] and the axis of symmetry is the y-axis, the parabola opens down.
The key features of a parabola are its vertex, axis of symmetry, focus, directrix, and latus rectum. When given a standard equation for a parabola centered at the origin, we can easily identify the key features to graph the parabola.
A line is said to be tangent to a curve if it intersects the curve at exactly one point. If we sketch lines tangent to the parabola at the endpoints of the latus rectum, these lines intersect on the axis of symmetry, as shown in Figure 6.
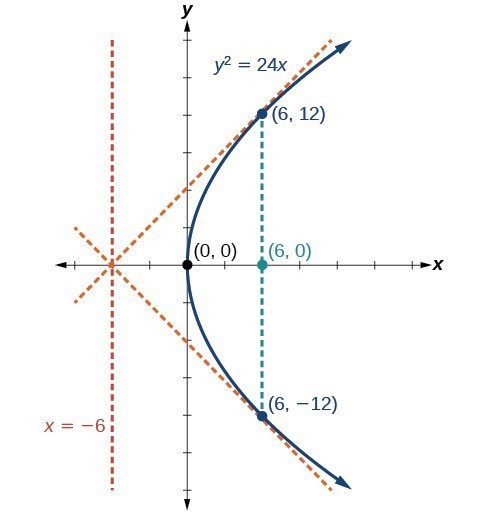
Figure 6
How To: Given a standard form equation for a parabola centered at (0, 0), sketch the graph.
- Determine which of the standard forms applies to the given equation: [latex]{y}^{2}=4px[/latex] or [latex]{x}^{2}=4py[/latex].
- Use the standard form identified in Step 1 to determine the axis of symmetry, focus, equation of the directrix, and endpoints of the latus rectum.
- If the equation is in the form [latex]{y}^{2}=4px[/latex], then
- the axis of symmetry is the x-axis, [latex]y=0[/latex]
- set [latex]4p[/latex] equal to the coefficient of x in the given equation to solve for [latex]p[/latex]. If [latex]p>0[/latex], the parabola opens right. If [latex]p<0[/latex], the parabola opens left.
- use [latex]p[/latex] to find the coordinates of the focus, [latex]\left(p,0\right)[/latex]
- use [latex]p[/latex] to find the equation of the directrix, [latex]x=-p[/latex]
- use [latex]p[/latex] to find the endpoints of the latus rectum, [latex]\left(p,\pm 2p\right)[/latex]. Alternately, substitute [latex]x=p[/latex] into the original equation.
- If the equation is in the form [latex]{x}^{2}=4py[/latex], then
- the axis of symmetry is the y-axis, [latex]x=0[/latex]
- set [latex]4p[/latex] equal to the coefficient of y in the given equation to solve for [latex]p[/latex]. If [latex]p>0[/latex], the parabola opens up. If [latex]p<0[/latex], the parabola opens down.
- use [latex]p[/latex] to find the coordinates of the focus, [latex]\left(0,p\right)[/latex]
- use [latex]p[/latex] to find equation of the directrix, [latex]y=-p[/latex]
- use [latex]p[/latex] to find the endpoints of the latus rectum, [latex]\left(\pm 2p,p\right)[/latex]
- If the equation is in the form [latex]{y}^{2}=4px[/latex], then
- Plot the focus, directrix, and latus rectum, and draw a smooth curve to form the parabola.
Example 1: Graphing a Parabola with Vertex (0, 0) and the x-axis as the Axis of Symmetry
Graph [latex]{y}^{2}=24x[/latex]. Identify and label the focus, directrix, and endpoints of the latus rectum.
Solution
The standard form that applies to the given equation is [latex]{y}^{2}=4px[/latex]. Thus, the axis of symmetry is the x-axis. It follows that:
- [latex]24=4p[/latex], so [latex]p=6[/latex]. Since [latex]p>0[/latex], the parabola opens right the coordinates of the focus are [latex]\left(p,0\right)=\left(6,0\right)[/latex]
- the equation of the directrix is [latex]x=-p=-6[/latex]
- the endpoints of the latus rectum have the same x-coordinate at the focus. To find the endpoints, substitute [latex]x=6[/latex] into the original equation: [latex]\left(6,\pm 12\right)[/latex]
Next we plot the focus, directrix, and latus rectum, and draw a smooth curve to form the parabola.
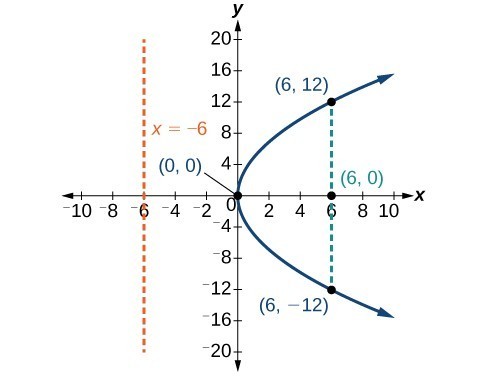
Figure 7
Try It 1
Graph [latex]{y}^{2}=-16x[/latex]. Identify and label the focus, directrix, and endpoints of the latus rectum.
Example 2: Graphing a Parabola with Vertex (0, 0) and the y-axis as the Axis of Symmetry
Graph [latex]{x}^{2}=-6y[/latex]. Identify and label the focus, directrix, and endpoints of the latus rectum.
Solution
The standard form that applies to the given equation is [latex]{x}^{2}=4py[/latex]. Thus, the axis of symmetry is the y-axis. It follows that:
- [latex]-6=4p[/latex], so [latex]p=-\frac{3}{2}[/latex]. Since [latex]p<0[/latex], the parabola opens down.
- the coordinates of the focus are [latex]\left(0,p\right)=\left(0,-\frac{3}{2}\right)[/latex]
- the equation of the directrix is [latex]y=-p=\frac{3}{2}[/latex]
- the endpoints of the latus rectum can be found by substituting [latex]\text{ }y=\frac{3}{2}\text{ }[/latex] into the original equation, [latex]\left(\pm 3,-\frac{3}{2}\right)[/latex]
Next we plot the focus, directrix, and latus rectum, and draw a smooth curve to form the parabola.
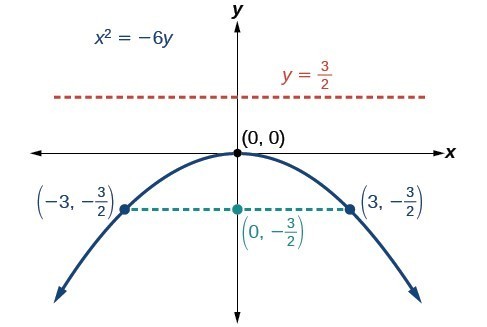
Figure 8
Try It 2
Graph [latex]{x}^{2}=8y[/latex]. Identify and label the focus, directrix, and endpoints of the latus rectum.
Writing Equations of Parabolas in Standard Form
In the previous examples, we used the standard form equation of a parabola to calculate the locations of its key features. We can also use the calculations in reverse to write an equation for a parabola when given its key features.
How To: Given its focus and directrix, write the equation for a parabola in standard form.
- Determine whether the axis of symmetry is the x– or y-axis.
- If the given coordinates of the focus have the form [latex]\left(p,0\right)[/latex], then the axis of symmetry is the x-axis. Use the standard form [latex]{y}^{2}=4px[/latex].
- If the given coordinates of the focus have the form [latex]\left(0,p\right)[/latex], then the axis of symmetry is the y-axis. Use the standard form [latex]{x}^{2}=4py[/latex].
- Multiply [latex]4p[/latex].
- Substitute the value from Step 2 into the equation determined in Step 1.
Example 3: Writing the Equation of a Parabola in Standard Form Given its Focus and Directrix
What is the equation for the parabola with focus [latex]\left(-\frac{1}{2},0\right)[/latex] and directrix [latex]x=\frac{1}{2}?[/latex]
Solution
The focus has the form [latex]\left(p,0\right)[/latex], so the equation will have the form [latex]{y}^{2}=4px[/latex].
Therefore, the equation for the parabola is [latex]{y}^{2}=-2x[/latex].
Try It 3
What is the equation for the parabola with focus [latex]\left(0,\frac{7}{2}\right)[/latex] and directrix [latex]y=-\frac{7}{2}?[/latex]
Candela Citations
- Precalculus. Authored by: OpenStax College. Provided by: OpenStax. Located at: http://cnx.org/contents/fd53eae1-fa23-47c7-bb1b-972349835c3c@5.175:1/Preface. License: CC BY: Attribution