Learning Objectives
By the end of this section, you will be able to:
- Plot ordered pairs in a Cartesian coordinate system.
- Graph equations by plotting points.
- Graph equations with a graphing utility.
- Find [latex]x[/latex] -intercepts and [latex]y[/latex] -intercepts.
- Use the distance formula.
- Use the midpoint formula.
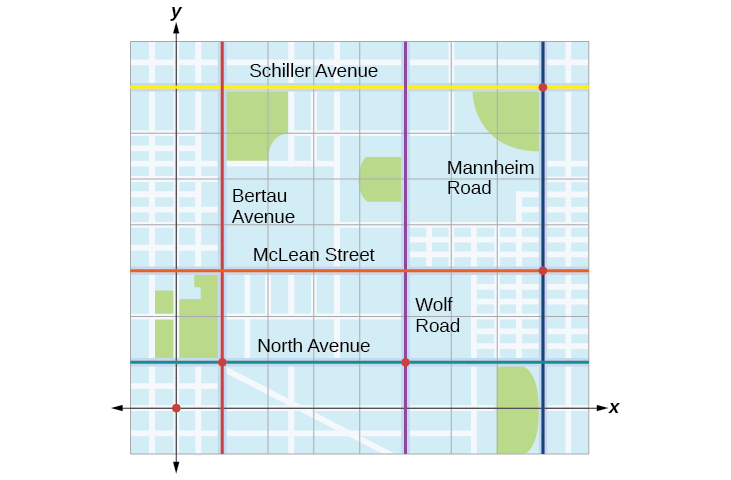
Figure 1
Tracie set out from Elmhurst, IL, to go to Franklin Park. On the way, she made a few stops to do errands. Each stop is indicated by a red dot in Figure 1. Laying a rectangular coordinate grid over the map, we can see that each stop aligns with an intersection of grid lines. In this section, we will learn how to use grid lines to describe locations and changes in locations.
Candela Citations
CC licensed content, Specific attribution
- College Algebra. Authored by: OpenStax College Algebra. Provided by: OpenStax. Located at: http://cnx.org/contents/9b08c294-057f-4201-9f48-5d6ad992740d@3.278:1/Preface. License: CC BY: Attribution