The graph of a quadratic function is a U-shaped curve called a parabola. One important feature of the graph is that it has an extreme point, called the vertex. If the parabola opens up, the vertex represents the lowest point on the graph, or the minimum value of the quadratic function. If the parabola opens down, the vertex represents the highest point on the graph, or the maximum value. In either case, the vertex is a turning point on the graph. The graph is also symmetric with a vertical line drawn through the vertex, called the axis of symmetry. These features are illustrated in Figure 2.
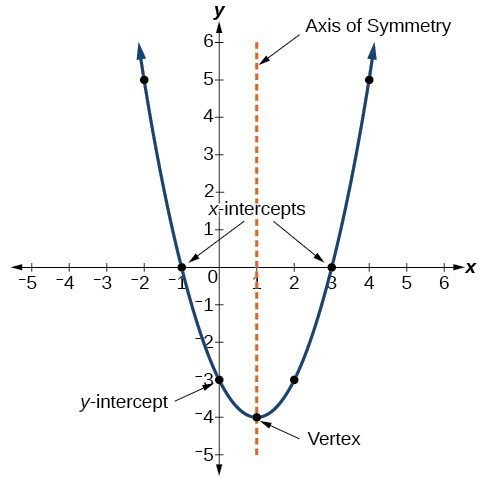
Figure 2
The y-intercept is the point at which the parabola crosses the y-axis. The x-intercepts are the points at which the parabola crosses the x-axis. If they exist, the x-intercepts represent the zeros, or roots, of the quadratic function, the values of x at which y = 0.
Example 1: Identifying the Characteristics of a Parabola
Determine the vertex, axis of symmetry, zeros, and y-intercept of the parabola shown in Figure 3.
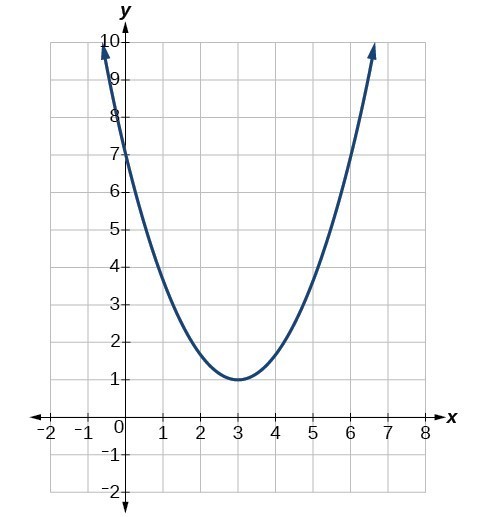
Figure 3
Solution
The vertex is the turning point of the graph. We can see that the vertex is at (3, 1). Because this parabola opens upward, the axis of symmetry is the vertical line that intersects the parabola at the vertex. So the axis of symmetry is x = 3. This parabola does not cross the x-axis, so it has no zeros. It crosses the y-axis at (0, 7) so this is the y-intercept.
Candela Citations
- Precalculus. Authored by: Jay Abramson, et al.. Provided by: OpenStax. Located at: http://cnx.org/contents/fd53eae1-fa23-47c7-bb1b-972349835c3c@5.175. License: CC BY: Attribution. License Terms: Download For Free at : http://cnx.org/contents/fd53eae1-fa23-47c7-bb1b-972349835c3c@5.175.