1. What term is used to express the likelihood of an event occurring? Are there restrictions on its values? If so, what are they? If not, explain.
2. What is a sample space?
3. What is an experiment?
4. What is the difference between events and outcomes? Give an example of both using the sample space of tossing a coin 50 times.
5. The union of two sets is defined as a set of elements that are present in at least one of the sets. How is this similar to the definition used for the union of two events from a probability model? How is it different?
For the following exercises, use the spinner shown in Figure 3 to find the probabilities indicated.
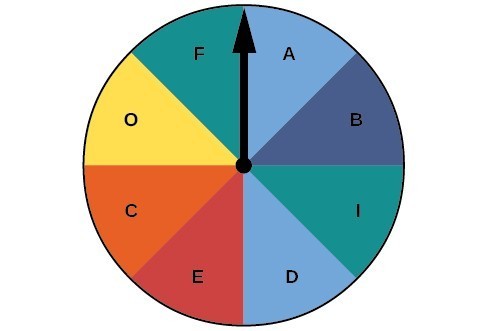
Figure 3
6. Landing on red
7. Landing on a vowel
8. Not landing on blue
9. Landing on purple or a vowel
10. Landing on blue or a vowel
11. Landing on green or blue
12. Landing on yellow or a consonant
13. Not landing on yellow or a consonant
For the following exercises, two coins are tossed.
14. What is the sample space?
15. Find the probability of tossing two heads.
16. Find the probability of tossing exactly one tail.
17. Find the probability of tossing at least one tail.
For the following exercises, four coins are tossed.
18. What is the sample space?
19. Find the probability of tossing exactly two heads.
20. Find the probability of tossing exactly three heads.
21. Find the probability of tossing four heads or four tails.
22. Find the probability of tossing all tails.
23. Find the probability of tossing not all tails.
24. Find the probability of tossing exactly two heads or at least two tails.
25. Find the probability of tossing either two heads or three heads.
For the following exercises, one card is drawn from a standard deck of [latex]52[/latex] cards. Find the probability of drawing the following:
26. A club
27. A two
28. Six or seven
29. Red six
30. An ace or a diamond
31. A non-ace
32. A heart or a non-jack
For the following exercises, two dice are rolled, and the results are summed.
33. Construct a table showing the sample space of outcomes and sums.
34. Find the probability of rolling a sum of [latex]3[/latex].
35. Find the probability of rolling at least one four or a sum of [latex]8[/latex].
36. Find the probability of rolling an odd sum less than [latex]9[/latex].
37. Find the probability of rolling a sum greater than or equal to [latex]15[/latex].
38. Find the probability of rolling a sum less than [latex]15[/latex].
39. Find the probability of rolling a sum less than [latex]6[/latex] or greater than [latex]9[/latex].
40. Find the probability of rolling a sum between [latex]6[/latex] and [latex]9[/latex], inclusive.
41. Find the probability of rolling a sum of [latex]5[/latex] or [latex]6[/latex].
42. Find the probability of rolling any sum other than [latex]5[/latex] or [latex]6[/latex].
For the following exercises, a coin is tossed, and a card is pulled from a standard deck. Find the probability of the following:
43. A head on the coin or a club
44. A tail on the coin or red ace
45. A head on the coin or a face card
46. No aces
For the following exercises, use this scenario: a bag of M&Ms contains [latex]12[/latex] blue, [latex]6[/latex] brown, [latex]10[/latex] orange, [latex]8[/latex] yellow, [latex]8[/latex] red, and [latex]4[/latex] green M&Ms. Reaching into the bag, a person grabs 5 M&Ms.
47. What is the probability of getting all blue M&Ms?
48. What is the probability of getting [latex]4[/latex] blue M&Ms?
49. What is the probability of getting [latex]3[/latex] blue M&Ms?
50. What is the probability of getting no brown M&Ms?
Use the following scenario for the exercises that follow: In the game of Keno, a player starts by selecting [latex]20[/latex] numbers from the numbers [latex]1[/latex] to [latex]80[/latex]. After the player makes his selections, [latex]20[/latex] winning numbers are randomly selected from numbers [latex]1[/latex] to [latex]80[/latex]. A win occurs if the player has correctly selected [latex]3,4[/latex], or [latex]5[/latex] of the [latex]20[/latex] winning numbers. (Round all answers to the nearest hundredth of a percent.)
51. What is the percent chance that a player selects exactly 3 winning numbers?
52. What is the percent chance that a player selects exactly 4 winning numbers?
53. What is the percent chance that a player selects all 5 winning numbers?
54. What is the percent chance of winning?
55. How much less is a player’s chance of selecting 3 winning numbers than the chance of selecting either 4 or 5 winning numbers?
Use this data for the exercises that follow: In 2013, there were roughly 317 million citizens in the United States, and about 40 million were elderly (aged 65 and over).[1]
56. If you meet a U.S. citizen, what is the percent chance that the person is elderly? (Round to the nearest tenth of a percent.)
57. If you meet five U.S. citizens, what is the percent chance that exactly one is elderly? (Round to the nearest tenth of a percent.)
58. If you meet five U.S. citizens, what is the percent chance that three are elderly? (Round to the nearest tenth of a percent.)
59. If you meet five U.S. citizens, what is the percent chance that four are elderly? (Round to the nearest thousandth of a percent.)
60. It is predicted that by 2030, one in five U.S. citizens will be elderly. How much greater will the chances of meeting an elderly person be at that time? What policy changes do you foresee if these statistics hold true?
Candela Citations
- Precalculus. Authored by: OpenStax College. Provided by: OpenStax. Located at: http://cnx.org/contents/fd53eae1-fa23-47c7-bb1b-972349835c3c@5.175:1/Preface. License: CC BY: Attribution
- United States Census Bureau. http://www.census.gov ↵