1. Explain how to find the input variable in a word problem that uses a linear function.
2. Explain how to find the output variable in a word problem that uses a linear function.
3. Explain how to interpret the initial value in a word problem that uses a linear function.
4. Explain how to determine the slope in a word problem that uses a linear function.
5. Find the area of a parallelogram bounded by the y axis, the line x = 3, the line f(x) = 1 + 2x, and the line parallel to f(x) passing through (2, 7).
6. Find the area of a triangle bounded by the x-axis, the line [latex]f\left(x\right)=12-\frac{1}{3}x[/latex], and the line perpendicular to f(x) that passes through the origin.
7. Find the area of a triangle bounded by the y-axis, the line [latex]f\left(x\right)=9-\frac{6}{7}x[/latex], and the line perpendicular to (x) that passes through the origin.
8. Find the area of a parallelogram bounded by the x-axis, the line g(x) = 2, the line f(x) = 3x, and the line parallel to f(x) passing through (6, 1).
For the following exercises, consider this scenario: A town’s population has been decreasing at a constant rate. In 2010 the population was 5,900. By 2012 the population had dropped 4,700. Assume this trend continues.
9. Predict the population in 2016.
10. Identify the year in which the population will reach 0.
For the following exercises, consider this scenario: A town’s population has been increased at a constant rate. In 2010 the population was 46,020. By 2012 the population had increased to 52,070. Assume this trend continues.
11. Predict the population in 2016.
12. Identify the year in which the population will reach 75,000.
For the following exercises, consider this scenario: A town has an initial population of 75,000. It grows at a constant rate of 2,500 per year for 5 years.
13. Find the linear function that models the town’s population P as a function of the year, t, where t is the number of years since the model began.
14. Find a reasonable domain and range for the function P.
15. If the function P is graphed, find and interpret the x- and y-intercepts.
16. If the function P is graphed, find and interpret the slope of the function.
17. When will the output reached 100,000?
18. What is the output in the year 12 years from the onset of the model?
For the following exercises, consider this scenario: The weight of a newborn is 7.5 pounds. The baby gained one-half pound a month for its first year.
19. Find the linear function that models the baby’s weight W as a function of the age of the baby, in months, t.
20. Find a reasonable domain and range for the function W.
21. If the function W is graphed, find and interpret the x– and y-intercepts.
22. If the function W is graphed, find and interpret the slope of the function.
23. When did the baby weight 10.4 pounds?
24. What is the output when the input is 6.2? Interpret your answer.
For the following exercises, consider this scenario: The number of people afflicted with the common cold in the winter months steadily decreased by 205 each year from 2005 until 2010. In 2005, 12,025 people were afflicted.
25. Find the linear function that models the number of people inflicted with the common cold C as a function of the year, t.
26. Find a reasonable domain and range for the function C.
27. If the function C is graphed, find and interpret the x– and y-intercepts.
28. If the function C is graphed, find and interpret the slope of the function.
29. When will the output reach 0?
30. In what year will the number of people be 9,700?
For the following exercises, use the graph below, which shows the profit, y, in thousands of dollars, of a company in a given year, t, where t represents the number of years since 1980.
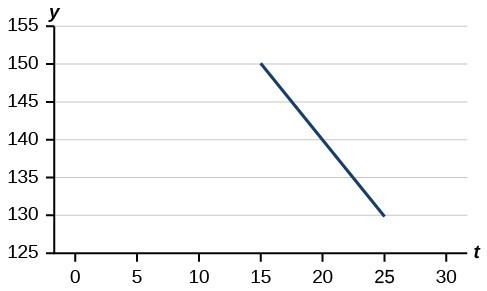
31. Find the linear function y, where y depends on t, the number of years since 1980.
32. Find and interpret the y-intercept.
33. Find and interpret the x-intercept.
34. Find and interpret the slope.
For the following exercises, use the graph in below, which shows the profit, y, in thousands of dollars, of a company in a given year, t, where t represents the number of years since 1980.
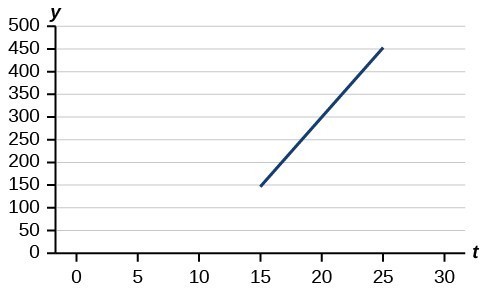
35. Find the linear function y, where y depends on t, the number of years since 1980.
36. Find and interpret the y-intercept.
37. Find and interpret the x-intercept.
38. Find and interpret the slope.
For the following exercises, use the median home values in Mississippi and Hawaii (adjusted for inflation) shown below. Assume that the house values are changing linearly.
| Year | Mississippi | Hawaii |
|---|---|---|
| 1950 | $25,200 | $74,400 |
| 2000 | $71,400 | $272,700 |
39. In which state have home values increased at a higher rate?
40. If these trends were to continue, what would be the median home value in Mississippi in 2010?
41. If we assume the linear trend existed before 1950 and continues after 2000, the two states’ median house values will be (or were) equal in what year? (The answer might be absurd.)
For the following exercises, use the median home values in Indiana and Alabama (adjusted for inflation) shown below. Assume that the house values are changing linearly.
| Year | Indiana | Alabama |
|---|---|---|
| 1950 | $37,700 | $27,100 |
| 2000 | $94,300 | $85,100 |
42. In which state have home values increased at a higher rate?
43. If these trends were to continue, what would be the median home value in Indiana in 2010?
44. If we assume the linear trend existed before 1950 and continues after 2000, the two states’ median house values will be (or were) equal in what year? (The answer might be absurd.)
45. In 2004, a school population was 1001. By 2008 the population had grown to 1697. Assume the population is changing linearly.
a. How much did the population grow between the year 2004 and 2008?
b. How long did it take the population to grow from 1001 students to 1697 students?
c. What is the average population growth per year?
d. What was the population in the year 2000?
e. Find an equation for the population, P, of the school t years after 2000.
f. Using your equation, predict the population of the school in 2011.
46. In 2003, a town’s population was 1,431. By 2007 the population had grown to 2,134. Assume the population is changing linearly.
a. How much did the population grow between the year 2003 and 2007?
b. How long did it take the population to grow from 1,431 people to 2,134 people?
c. What is the average population growth per year?
d. What was the population in the year 2000?
e. Find an equation for the population, P of the town t years after 2000.
f. Using your equation, predict the population of the town in 2014.
47. A phone company has a monthly cellular plan where a customer pays a flat monthly fee and then a certain amount of money per minute used on the phone. If a customer uses 410 minutes, the monthly cost will be $71.50. If the customer uses 720 minutes, the monthly cost will be $118.
a. Find a linear equation for the monthly cost of the cell plan as a function of x, the number of monthly minutes used.
b. Interpret the slope and y-intercept of the equation.
c. Use your equation to find the total monthly cost if 687 minutes are used.
48. A phone company has a monthly cellular data plan where a customer pays a flat monthly fee of $10 and then a certain amount of money per megabyte (MB) of data used on the phone. If a customer uses 20 MB, the monthly cost will be $11.20. If the customer uses 130 MB, the monthly cost will be $17.80.
a. Find a linear equation for the monthly cost of the data plan as a function of x, the number of MB used.
b. Interpret the slope and y-intercept of the equation.
c. Use your equation to find the total monthly cost if 250 MB are used.
49. In 1991, the moose population in a park was measured to be 4,360. By 1999, the population was measured again to be 5,880. Assume the population continues to change linearly.
a. Find a formula for the moose population, P since 1990.
b. What does your model predict the moose population to be in 2003?
50. In 2003, the owl population in a park was measured to be 340. By 2007, the population was measured again to be 285. The population changes linearly. Let the input be years since 1990.
a. Find a formula for the owl population, P. Let the input be years since 2003.
b. What does your model predict the owl population to be in 2012?
51. The Federal Helium Reserve held about 16 billion cubic feet of helium in 2010 and is being depleted by about 2.1 billion cubic feet each year.
a. Give a linear equation for the remaining federal helium reserves, R, in terms of t, the number of years since 2010.
b. In 2015, what will the helium reserves be?
c. If the rate of depletion doesn’t change, in what year will the Federal Helium Reserve be depleted?
52. Suppose the world’s oil reserves in 2014 are 1,820 billion barrels. If, on average, the total reserves are decreasing by 25 billion barrels of oil each year:
a. Give a linear equation for the remaining oil reserves, R, in terms of t the number of years since now.
b. Seven years from now, what will the oil reserves be?
c. If the rate at which the reserves are decreasing is constant, when will the world’s oil reserves be depleted?
53. You are choosing between two different prepaid cell phone plans. The first plan charges a rate of 26 cents per minute. The second plan charges a monthly fee of $19.95 plus 11 cents per minute. How many minutes would you have to use in a month in order for the second plan to be preferable?
54. You are choosing between two different window washing companies. The first charges $5 per window. The second charges a base fee of $40 plus $3 per window. How many windows would you need to have for the second company to be preferable?
55. When hired at a new job selling jewelry, you are given two pay options:
Option A: Base salary of $17,000 a year with a commission of 12% of your sales
Option B: Base salary of $20,000 a year with a commission of 5% of your sales
How much jewelry would you need to sell for option A to produce a larger income?
56. When hired at a new job selling electronics, you are given two pay options:
Option A: Base salary of $14,000 a year with a commission of 10% of your sales
Option B: Base salary of $19,000 a year with a commission of 4% of your sales
How much electronics would you need to sell for option A to produce a larger income?
57. When hired at a new job selling electronics, you are given two pay options:
Option A: Base salary of $20,000 a year with a commission of 12% of your sales
Option B: Base salary of $26,000 a year with a commission of 3% of your sales
How much electronics would you need to sell for option A to produce a larger income?
58. When hired at a new job selling electronics, you are given two pay options:
Option A: Base salary of $10,000 a year with a commission of 9% of your sales
Option B: Base salary of $20,000 a year with a commission of 4% of your sales
How much electronics would you need to sell for option A to produce a larger income?
Candela Citations
- Precalculus. Authored by: Jay Abramson, et al.. Provided by: OpenStax. Located at: http://cnx.org/contents/fd53eae1-fa23-47c7-bb1b-972349835c3c@5.175. License: CC BY: Attribution. License Terms: Download For Free at : http://cnx.org/contents/fd53eae1-fa23-47c7-bb1b-972349835c3c@5.175.