Solutions to Try Its
1. [latex]\left(2,\infty \right)[/latex]
2. [latex]\left(5,\infty \right)[/latex]
3. The domain is [latex]\left(0,\infty \right)[/latex], the range is [latex]\left(-\infty ,\infty \right)[/latex], and the vertical asymptote is x = 0.

4. The domain is [latex]\left(-4,\infty \right)[/latex], the range [latex]\left(-\infty ,\infty \right)[/latex], and the asymptote x = –4.

5. The domain is [latex]\left(0,\infty \right)[/latex], the range is [latex]\left(-\infty ,\infty \right)[/latex], and the vertical asymptote is x = 0.

6. The domain is [latex]\left(0,\infty \right)[/latex], the range is [latex]\left(-\infty ,\infty \right)[/latex], and the vertical asymptote is x = 0.

7. The domain is [latex]\left(2,\infty \right)[/latex], the range is [latex]\left(-\infty ,\infty \right)[/latex], and the vertical asymptote is x = 2.

8. The domain is [latex]\left(-\infty ,0\right)[/latex], the range is [latex]\left(-\infty ,\infty \right)[/latex], and the vertical asymptote is x = 0.

9. [latex]x\approx 3.049[/latex]
10. x = 1
11. [latex]f\left(x\right)=2\mathrm{ln}\left(x+3\right)-1[/latex]
Solutions to Odd-Numbered Exercises
1. Since the functions are inverses, their graphs are mirror images about the line y = x. So for every point [latex]\left(a,b\right)[/latex] on the graph of a logarithmic function, there is a corresponding point [latex]\left(b,a\right)[/latex] on the graph of its inverse exponential function.
3. Shifting the function right or left and reflecting the function about the y-axis will affect its domain.
5. No. A horizontal asymptote would suggest a limit on the range, and the range of any logarithmic function in general form is all real numbers.
7. Domain: [latex]\left(-\infty ,\frac{1}{2}\right)[/latex]; Range: [latex]\left(-\infty ,\infty \right)[/latex]
9. Domain: [latex]\left(-\frac{17}{4},\infty \right)[/latex]; Range: [latex]\left(-\infty ,\infty \right)[/latex]
11. Domain: [latex]\left(5,\infty \right)[/latex]; Vertical asymptote: x = 5
13. Domain: [latex]\left(-\frac{1}{3},\infty \right)[/latex]; Vertical asymptote: [latex]x=-\frac{1}{3}[/latex]
15. Domain: [latex]\left(-3,\infty \right)[/latex]; Vertical asymptote: x = –3
17. Domain: [latex]\left(\frac{3}{7},\infty \right)[/latex]; Vertical asymptote: [latex]x=\frac{3}{7}[/latex] ; End behavior: as [latex]x\to {\left(\frac{3}{7}\right)}^{+},f\left(x\right)\to -\infty[/latex] and as [latex]x\to \infty ,f\left(x\right)\to \infty[/latex]
19. Domain: [latex]\left(-3,\infty \right)[/latex] ; Vertical asymptote: x = –3; End behavior: as [latex]x\to -{3}^{+}[/latex] , [latex]f\left(x\right)\to -\infty[/latex] and as [latex]x\to \infty[/latex] , [latex]f\left(x\right)\to \infty[/latex]
21. Domain: [latex]\left(1,\infty \right)[/latex]; Range: [latex]\left(-\infty ,\infty \right)[/latex]; Vertical asymptote: x = 1; x-intercept: [latex]\left(\frac{5}{4},0\right)[/latex]; y-intercept: DNE
23. Domain: [latex]\left(-\infty ,0\right)[/latex]; Range: [latex]\left(-\infty ,\infty \right)[/latex]; Vertical asymptote: x = 0; x-intercept: [latex]\left(-{e}^{2},0\right)[/latex]; y-intercept: DNE
25. Domain: [latex]\left(0,\infty \right)[/latex]; Range: [latex]\left(-\infty ,\infty \right)[/latex]; Vertical asymptote: x = 0; x-intercept: [latex]\left({e}^{3},0\right)[/latex]; y-intercept: DNE
27. B
29. C
31. B
33. C
35.

37.

39. C
41.

43.

45.

47. [latex]f\left(x\right)={\mathrm{log}}_{2}\left(-\left(x - 1\right)\right)[/latex]
49. [latex]f\left(x\right)=3{\mathrm{log}}_{4}\left(x+2\right)[/latex]
51. x = 2
53. [latex]x\approx \text{2}\text{.303}[/latex]
55. [latex]x\approx -0.472[/latex]
57. The graphs of [latex]f\left(x\right)={\mathrm{log}}_{\frac{1}{2}}\left(x\right)[/latex] and [latex]g\left(x\right)=-{\mathrm{log}}_{2}\left(x\right)[/latex] appear to be the same; Conjecture: for any positive base [latex]b\ne 1[/latex], [latex]{\mathrm{log}}_{b}\left(x\right)=-{\mathrm{log}}_{\frac{1}{b}}\left(x\right)[/latex].
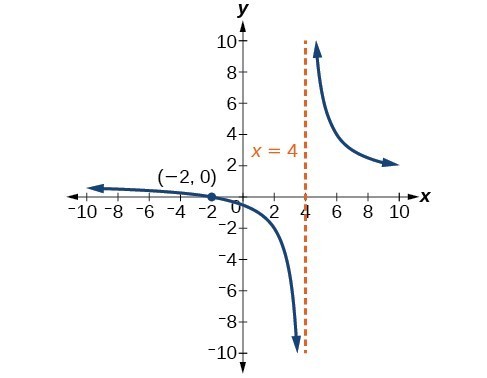
59. Recall that the argument of a logarithmic function must be positive, so we determine where [latex]\frac{x+2}{x - 4}>0[/latex] . From the graph of the function [latex]f\left(x\right)=\frac{x+2}{x - 4}[/latex], note that the graph lies above the x-axis on the interval [latex]\left(-\infty ,-2\right)[/latex] and again to the right of the vertical asymptote, that is [latex]\left(4,\infty \right)[/latex]. Therefore, the domain is [latex]\left(-\infty ,-2\right)\cup \left(4,\infty \right)[/latex].
Candela Citations
- Precalculus. Authored by: Jay Abramson, et al.. Provided by: OpenStax. Located at: http://cnx.org/contents/fd53eae1-fa23-47c7-bb1b-972349835c3c@5.175. License: CC BY: Attribution. License Terms: Download For Free at : http://cnx.org/contents/fd53eae1-fa23-47c7-bb1b-972349835c3c@5.175.