Once we determine that a set of data is linear using the correlation coefficient, we can use the regression line to make predictions. As we learned previously, a regression line is a line that is closest to the data in the scatter plot, which means that only one such line is a best fit for the data.
Example 6: Using a Regression Line to Make Predictions
Gasoline consumption in the United States has been steadily increasing. Consumption data from 1994 to 2004 is shown in the table below.[1] Determine whether the trend is linear, and if so, find a model for the data. Use the model to predict the consumption in 2008.
| Year | ’94 | ’95 | ’96 | ’97 | ’98 | ’99 | ’00 | ’01 | ’02 | ’03 | ’04 |
| Consumption (billions of gallons) | 113 | 116 | 118 | 119 | 123 | 125 | 126 | 128 | 131 | 133 | 136 |
The scatter plot of the data, including the least squares regression line, is shown in Figure 8.
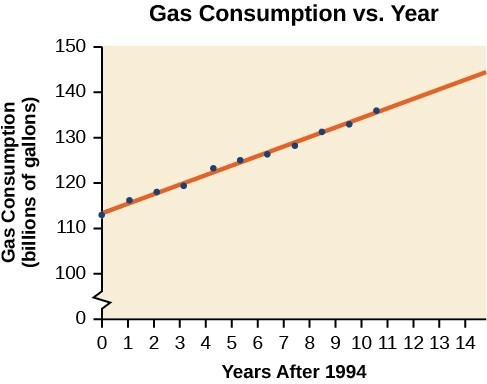
Figure 8
Solution
We can introduce new input variable, t, representing years since 1994.
The least squares regression equation is:
Using technology, the correlation coefficient was calculated to be 0.9965, suggesting a very strong increasing linear trend.
Using this to predict consumption in 2008 [latex]\left(t=14\right)[/latex],
The model predicts 144.244 billion gallons of gasoline consumption in 2008.
Try It 2
Use the model we created using technology in Example 6 to predict the gas consumption in 2011. Is this an interpolation or an extrapolation?
Candela Citations
- Precalculus. Authored by: Jay Abramson, et al.. Provided by: OpenStax. Located at: http://cnx.org/contents/fd53eae1-fa23-47c7-bb1b-972349835c3c@5.175. License: CC BY: Attribution. License Terms: Download For Free at : http://cnx.org/contents/fd53eae1-fa23-47c7-bb1b-972349835c3c@5.175.