Using what we have learned about systems of equations, we can return to the skateboard manufacturing problem at the beginning of the section. The skateboard manufacturer’s revenue function is the function used to calculate the amount of money that comes into the business. It can be represented by the equation [latex]R=xp[/latex], where [latex]x=[/latex] quantity and [latex]p=[/latex] price. The revenue function is shown in orange in Figure 10.
The cost function is the function used to calculate the costs of doing business. It includes fixed costs, such as rent and salaries, and variable costs, such as utilities. The cost function is shown in blue in Figure 10. The [latex]x[/latex] -axis represents quantity in hundreds of units. The y-axis represents either cost or revenue in hundreds of dollars.
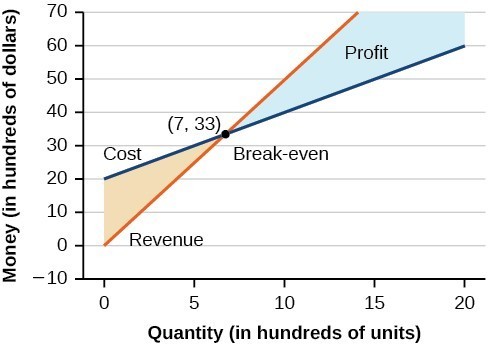
The point at which the two lines intersect is called the break-even point. We can see from the graph that if 700 units are produced, the cost is $3,300 and the revenue is also $3,300. In other words, the company breaks even if they produce and sell 700 units. They neither make money nor lose money.
The shaded region to the right of the break-even point represents quantities for which the company makes a profit. The shaded region to the left represents quantities for which the company suffers a loss. The profit function is the revenue function minus the cost function, written as [latex]P\left(x\right)=R\left(x\right)-C\left(x\right)[/latex]. Clearly, knowing the quantity for which the cost equals the revenue is of great importance to businesses.
Example 10: Finding the Break-Even Point and the Profit Function Using Substitution
Given the cost function [latex]C\left(x\right)=0.85x+35,000[/latex] and the revenue function [latex]R\left(x\right)=1.55x[/latex], find the break-even point and the profit function.
Solution
Write the system of equations using [latex]y[/latex] to replace function notation.
Substitute the expression [latex]0.85x+35,000[/latex] from the first equation into the second equation and solve for [latex]x[/latex].
Then, we substitute [latex]x=50,000[/latex] into either the cost function or the revenue function.
The break-even point is [latex]\left(50,000,77,500\right)[/latex].
The profit function is found using the formula [latex]P\left(x\right)=R\left(x\right)-C\left(x\right)[/latex].
The profit function is [latex]P\left(x\right)=0.7x - 35,000[/latex].
Analysis of the Solution
The cost to produce 50,000 units is $77,500, and the revenue from the sales of 50,000 units is also $77,500. To make a profit, the business must produce and sell more than 50,000 units.
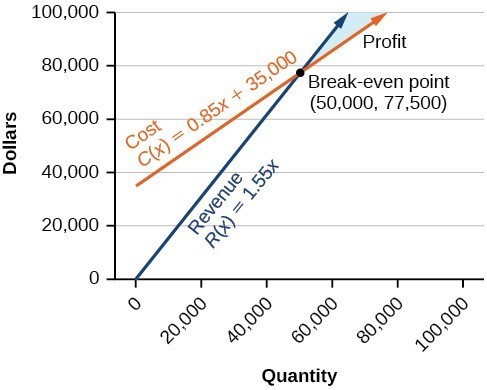
Figure 11
We see from the graph in Figure 12 that the profit function has a negative value until [latex]x=50,000[/latex], when the graph crosses the x-axis. Then, the graph emerges into positive y-values and continues on this path as the profit function is a straight line. This illustrates that the break-even point for businesses occurs when the profit function is 0. The area to the left of the break-even point represents operating at a loss.
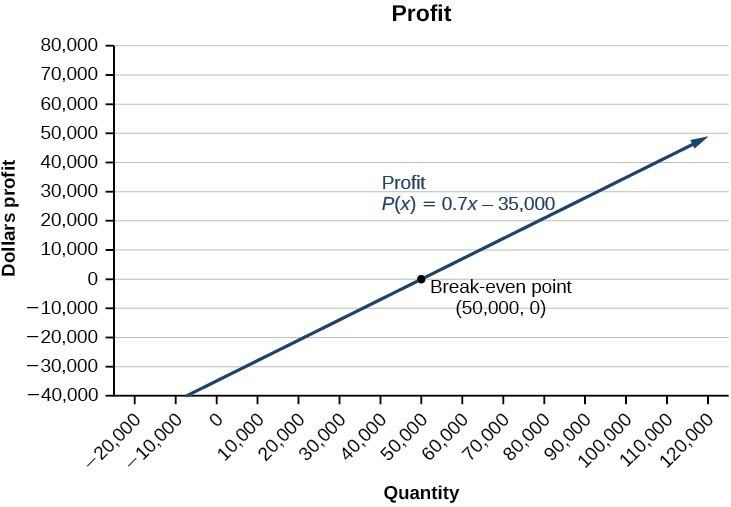
Figure 12
Example 11: Writing and Solving a System of Equations in Two Variables
The cost of a ticket to the circus is $25.00 for children and $50.00 for adults. On a certain day, attendance at the circus is 2,000 and the total gate revenue is $70,000. How many children and how many adults bought tickets?
Solution
Let c = the number of children and a = the number of adults in attendance.
The total number of people is [latex]2,000[/latex]. We can use this to write an equation for the number of people at the circus that day.
The revenue from all children can be found by multiplying $25.00 by the number of children, [latex]25c[/latex]. The revenue from all adults can be found by multiplying $50.00 by the number of adults, [latex]50a[/latex]. The total revenue is $70,000. We can use this to write an equation for the revenue.
We now have a system of linear equations in two variables.
In the first equation, the coefficient of both variables is 1. We can quickly solve the first equation for either [latex]c[/latex] or [latex]a[/latex]. We will solve for [latex]a[/latex].
Substitute the expression [latex]2,000-c[/latex] in the second equation for [latex]a[/latex] and solve for [latex]c[/latex].
Substitute [latex]c=1,200[/latex] into the first equation to solve for [latex]a[/latex].
We find that [latex]1,200[/latex] children and [latex]800[/latex] adults bought tickets to the circus that day.
Try It 8
Meal tickets at the circus cost $4.00 for children and $12.00 for adults. If 1,650 meal tickets were bought for a total of $14,200, how many children and how many adults bought meal tickets?
Candela Citations
- Precalculus. Authored by: OpenStax College. Provided by: OpenStax. Located at: http://cnx.org/contents/fd53eae1-fa23-47c7-bb1b-972349835c3c@5.175:1/Preface. License: CC BY: Attribution