Learning Objectives
- Given two data points, write an exponential function
- Identify initial conditions for an exponential function
- Find an exponential function given a graph
- Use a graphing calculator to find an exponential function
- Find an exponential function that models continuous growth or decay
In the previous examples, we were given an exponential function, which we then evaluated for a given input. Sometimes we are given information about an exponential function without knowing the function explicitly. We must use the information to first write the form of the function, then determine the constants a and b, and evaluate the function.
How To: Given two data points, write an exponential model.
- If one of the data points has the form [latex]\left(0,a\right)[/latex], then a is the initial value. Using a, substitute the second point into the equation [latex]f\left(x\right)=a{\left(b\right)}^{x}[/latex], and solve for b.
- If neither of the data points have the form [latex]\left(0,a\right)[/latex], substitute both points into two equations with the form [latex]f\left(x\right)=a{\left(b\right)}^{x}[/latex]. Solve the resulting system of two equations in two unknowns to find a and b.
- Using the a and b found in the steps above, write the exponential function in the form [latex]f\left(x\right)=a{\left(b\right)}^{x}[/latex].
Example: Writing an Exponential Model When the Initial Value Is Known
In 2006, 80 deer were introduced into a wildlife refuge. By 2012, the population had grown to 180 deer. The population was growing exponentially. Write an algebraic function N(t) representing the population N of deer over time t.
Try It
A wolf population is growing exponentially. In 2011, 129 wolves were counted. By 2013 the population had reached 236 wolves. What two points can be used to derive an exponential equation modeling this situation? Write the equation representing the population N of wolves over time t.
Example: Writing an Exponential Model When the Initial Value is Not Known
Find an exponential function that passes through the points [latex]\left(-2,6\right)[/latex] and [latex]\left(2,1\right)[/latex].
Try It
Given the two points [latex]\left(1,3\right)[/latex] and [latex]\left(2,4.5\right)[/latex], find the equation of the exponential function that passes through these two points.
Q & A
Do two points always determine a unique exponential function?
Yes, provided the two points are either both above the x-axis or both below the x-axis and have different x-coordinates. But keep in mind that we also need to know that the graph is, in fact, an exponential function. Not every graph that looks exponential really is exponential. We need to know the graph is based on a model that shows the same percent growth with each unit increase in x, which in many real world cases involves time.
How To: Given the graph of an exponential function, write its equation.
- First, identify two points on the graph. Choose the y-intercept as one of the two points whenever possible. Try to choose points that are as far apart as possible to reduce round-off error.
- If one of the data points is the y-intercept [latex]\left(0,a\right)[/latex] , then a is the initial value. Using a, substitute the second point into the equation [latex]f\left(x\right)=a{\left(b\right)}^{x}[/latex], and solve for b.
- If neither of the data points have the form [latex]\left(0,a\right)[/latex], substitute both points into two equations with the form [latex]f\left(x\right)=a{\left(b\right)}^{x}[/latex]. Solve the resulting system of two equations in two unknowns to find a and b.
- Write the exponential function, [latex]f\left(x\right)=a{\left(b\right)}^{x}[/latex].
Example: Writing an Exponential Function Given Its Graph
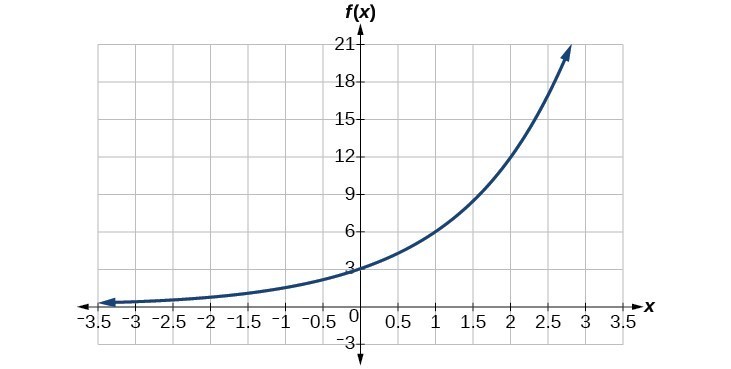
Find an equation for the exponential function graphed below.

Try It
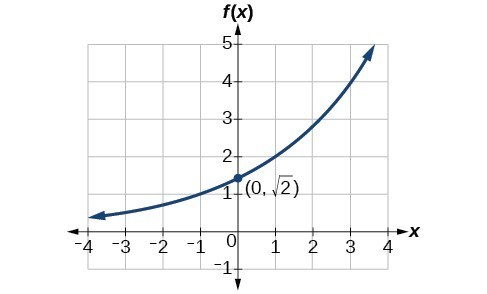
Find an equation for the exponential function graphed below.

How To: Given two points on the curve of an exponential function, use Desmos to find the equation.
- Create a table by clicking on the plus “+ ” sign and choosing table.
- Enter your points in the table.
- Enter y1 ~ [latex]a*b^{x1}[/latex], a graph of the model will appear!
- You will see values for a, b at the bottom of the entry box.
- You can determine how well the model fits your data by looking at the [latex]r^2[/latex] value. The closer it is to 1, the better your model.
Try It
Use Desmos to find two exponential equations:
- One that includes the points [latex]\left(2,24.8\right)[/latex]
- And another that includes the points [latex]\left(5,198.4\right)[/latex].
Investigating Continuous Growth
So far we have worked with rational bases for exponential functions. For most real-world phenomena, however, e is used as the base for exponential functions. Exponential models that use e as the base are called continuous growth or decay models. We see these models in finance, computer science, and most of the sciences, such as physics, toxicology, and fluid dynamics.
A General Note: The Continuous Growth/Decay Formula
For all real numbers t, and all positive numbers a and r, continuous growth or decay is represented by the formula
[latex]A\left(t\right)=a{e}^{rt}[/latex]
where
- a is the initial value,
- r is the continuous growth rate per unit time,
- and t is the elapsed time.
If r > 0, then the formula represents continuous growth. If r < 0, then the formula represents continuous decay.
For business applications, the continuous growth formula is called the continuous compounding formula and takes the form
[latex]A\left(t\right)=P{e}^{rt}[/latex]
where
- P is the principal or the initial invested,
- r is the growth or interest rate per unit time,
- and t is the period or term of the investment.
How To: Given the initial value, rate of growth or decay, and time t, solve a continuous growth or decay function.
- Use the information in the problem to determine a, the initial value of the function.
- Use the information in the problem to determine the growth rate r.
- If the problem refers to continuous growth, then r > 0.
- If the problem refers to continuous decay, then r < 0.
- Use the information in the problem to determine the time t.
- Substitute the given information into the continuous growth formula and solve for A(t).
Example: Calculating Continuous Growth
A person invested $1,000 in an account earning a nominal 10% per year compounded continuously. How much was in the account at the end of one year?
Try It
A person invests $100,000 at a nominal 12% interest per year compounded continuously. What will be the value of the investment in 30 years?
Example: Calculating Continuous Decay
Radon-222 decays at a continuous rate of 17.3% per day. How much will 100 mg of Radon-222 decay to in 3 days?
Try It
Using the data in the previous example, how much radon-222 will remain after one year?
Candela Citations
- Revision and Adaptation. Provided by: Lumen Learning. License: CC BY: Attribution
- Question ID 25526 . Authored by: Morales,Lawrence, mb Lippman,David, mb Sousa,James. License: CC BY: Attribution. License Terms: IMathAS Community License CC-BY + GPL
- College Algebra. Authored by: Abramson, Jay et al.. Provided by: OpenStax. Located at: http://cnx.org/contents/9b08c294-057f-4201-9f48-5d6ad992740d@5.2. License: CC BY: Attribution. License Terms: Download for free at http://cnx.org/contents/9b08c294-057f-4201-9f48-5d6ad992740d@5.2
- Question ID 2942. Authored by: Anderson,Tophe. License: CC BY: Attribution. License Terms: IMathAS Community License CC-BY + GPL

