Learning Objectives
- Graph a hyperbola centered at the origin
- Graph a hyperbola not centered at the origin
When we have an equation in standard form for a hyperbola centered at the origin, we can interpret its parts to identify the key features of its graph: the center, vertices, co-vertices, asymptotes, foci, and lengths and positions of the transverse and conjugate axes. To graph hyperbolas centered at the origin, we use the standard form [latex]\frac{{x}^{2}}{{a}^{2}}-\frac{{y}^{2}}{{b}^{2}}=1[/latex] for horizontal hyperbolas and the standard form [latex]\frac{{y}^{2}}{{a}^{2}}-\frac{{x}^{2}}{{b}^{2}}=1[/latex] for vertical hyperbolas.
How To: Given a standard form equation for a hyperbola centered at [latex]\left(0,0\right)[/latex], sketch the graph.
- Determine which of the standard forms applies to the given equation.
- Use the standard form identified in Step 1 to determine the position of the transverse axis; coordinates for the vertices, co-vertices, and foci; and the equations for the asymptotes.
- If the equation is in the form [latex]\frac{{x}^{2}}{{a}^{2}}-\frac{{y}^{2}}{{b}^{2}}=1[/latex], then
- the transverse axis is on the x-axis
- the coordinates of the vertices are [latex]\left(\pm a,0\right)[/latex]
- the coordinates of the co-vertices are [latex]\left(0,\pm b\right)[/latex]
- the coordinates of the foci are [latex]\left(\pm c,0\right)[/latex]
- the equations of the asymptotes are [latex]y=\pm \frac{b}{a}x[/latex]
- If the equation is in the form [latex]\frac{{y}^{2}}{{a}^{2}}-\frac{{x}^{2}}{{b}^{2}}=1[/latex], then
- the transverse axis is on the y-axis
- the coordinates of the vertices are [latex]\left(0,\pm a\right)[/latex]
- the coordinates of the co-vertices are [latex]\left(\pm b,0\right)[/latex]
- the coordinates of the foci are [latex]\left(0,\pm c\right)[/latex]
- the equations of the asymptotes are [latex]y=\pm \frac{a}{b}x[/latex]
- If the equation is in the form [latex]\frac{{x}^{2}}{{a}^{2}}-\frac{{y}^{2}}{{b}^{2}}=1[/latex], then
- Solve for the coordinates of the foci using the equation [latex]c=\pm \sqrt{{a}^{2}+{b}^{2}}[/latex].
- Plot the vertices, co-vertices, foci, and asymptotes in the coordinate plane, and draw a smooth curve to form the hyperbola.
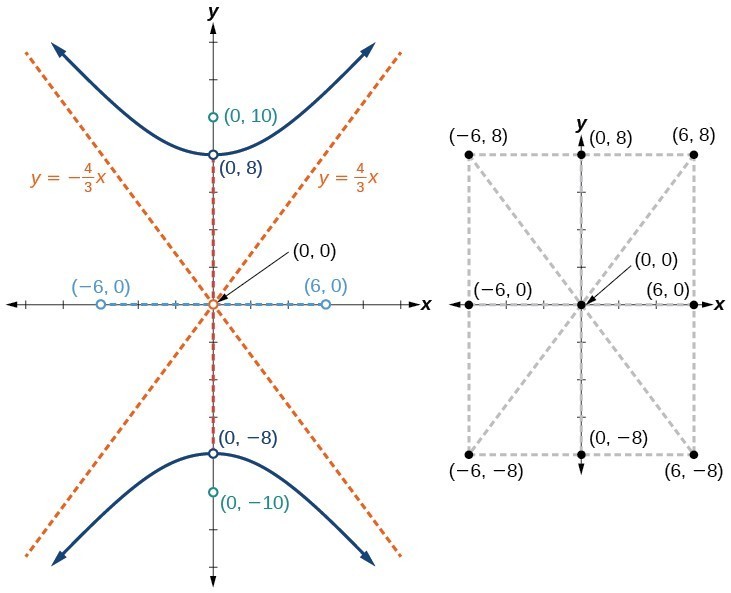
Example: Graphing a Hyperbola Centered at (0, 0) Given an Equation in Standard Form
Graph the hyperbola given by the equation [latex]\frac{{y}^{2}}{64}-\frac{{x}^{2}}{36}=1[/latex]. Identify and label the vertices, co-vertices, foci, and asymptotes.
Try It
Graph the hyperbola given by the equation [latex]\frac{{x}^{2}}{144}-\frac{{y}^{2}}{81}=1[/latex]. Identify and label the vertices, co-vertices, foci, and asymptotes.
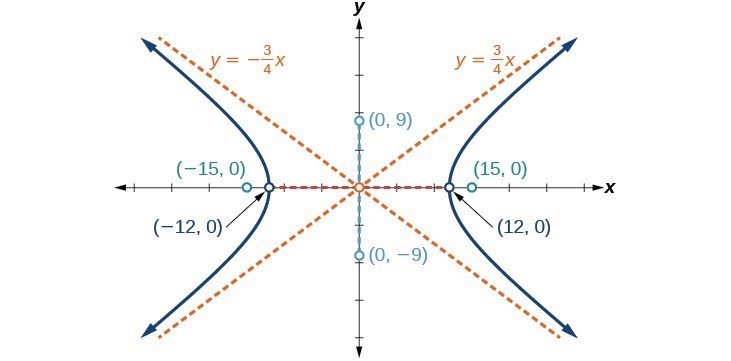
Try It
In the graph below you will find the plot of a Hyperbola centered at the origin. Note the equation used to generate the graph is [latex]\frac{x^2}{a^2} - \frac{y^2}{b^2} = 1[/latex], and the variables [latex]a,b[/latex] are free to slide between [latex]1, 20[/latex]. Your task in this exercise is to use the free variables to add the following features to the graph:
- vertices
- co-vertices
- foci
- asymptotes
For example, to plot the vertices, you would define two points like this: [latex](a,0)[/latex] and [latex](-a,0)[/latex] on their own lines.
https://www.desmos.com/calculator/du6j3vvisl
Graphing Hyperbolas Not Centered at the Origin
Graphing hyperbolas centered at a point [latex]\left(h,k\right)[/latex] other than the origin is similar to graphing ellipses centered at a point other than the origin. We use the standard forms [latex]\frac{{\left(x-h\right)}^{2}}{{a}^{2}}-\frac{{\left(y-k\right)}^{2}}{{b}^{2}}=1[/latex] for horizontal hyperbolas, and [latex]\frac{{\left(y-k\right)}^{2}}{{a}^{2}}-\frac{{\left(x-h\right)}^{2}}{{b}^{2}}=1[/latex] for vertical hyperbolas. From these standard form equations we can easily calculate and plot key features of the graph: the coordinates of its center, vertices, co-vertices, and foci; the equations of its asymptotes; and the positions of the transverse and conjugate axes.
How To: Given a general form for a hyperbola centered at [latex]\left(h,k\right)[/latex], sketch the graph.
- Convert the general form to that standard form. Determine which of the standard forms applies to the given equation.
- Use the standard form identified in Step 1 to determine the position of the transverse axis; coordinates for the center, vertices, co-vertices, foci; and equations for the asymptotes.
- If the equation is in the form [latex]\frac{{\left(x-h\right)}^{2}}{{a}^{2}}-\frac{{\left(y-k\right)}^{2}}{{b}^{2}}=1[/latex], then
- the transverse axis is parallel to the x-axis
- the center is [latex]\left(h,k\right)[/latex]
- the coordinates of the vertices are [latex]\left(h\pm a,k\right)[/latex]
- the coordinates of the co-vertices are [latex]\left(h,k\pm b\right)[/latex]
- the coordinates of the foci are [latex]\left(h\pm c,k\right)[/latex]
- the equations of the asymptotes are [latex]y=\pm \frac{b}{a}\left(x-h\right)+k[/latex]
- If the equation is in the form [latex]\frac{{\left(y-k\right)}^{2}}{{a}^{2}}-\frac{{\left(x-h\right)}^{2}}{{b}^{2}}=1[/latex], then
- the transverse axis is parallel to the y-axis
- the center is [latex]\left(h,k\right)[/latex]
- the coordinates of the vertices are [latex]\left(h,k\pm a\right)[/latex]
- the coordinates of the co-vertices are [latex]\left(h\pm b,k\right)[/latex]
- the coordinates of the foci are [latex]\left(h,k\pm c\right)[/latex]
- the equations of the asymptotes are [latex]y=\pm \frac{a}{b}\left(x-h\right)+k[/latex]
- If the equation is in the form [latex]\frac{{\left(x-h\right)}^{2}}{{a}^{2}}-\frac{{\left(y-k\right)}^{2}}{{b}^{2}}=1[/latex], then
- Solve for the coordinates of the foci using the equation [latex]c=\pm \sqrt{{a}^{2}+{b}^{2}}[/latex].
- Plot the center, vertices, co-vertices, foci, and asymptotes in the coordinate plane and draw a smooth curve to form the hyperbola.
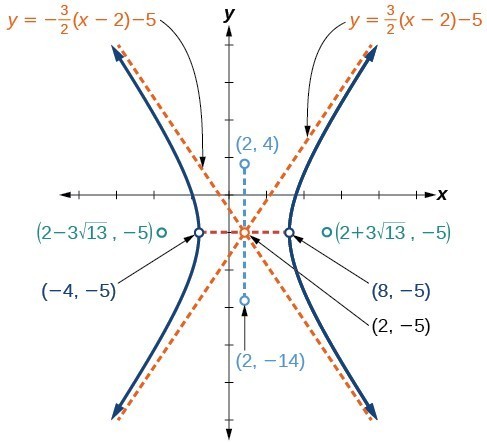
Example: Graphing a Hyperbola Centered at (h, k) Given an Equation in General Form
Graph the hyperbola given by the equation [latex]9{x}^{2}-4{y}^{2}-36x - 40y - 388=0[/latex]. Identify and label the center, vertices, co-vertices, foci, and asymptotes.
Try It
Graph the hyperbola given by the standard form of an equation [latex]\frac{{\left(y+4\right)}^{2}}{100}-\frac{{\left(x - 3\right)}^{2}}{64}=1[/latex]. Identify and label the center, vertices, co-vertices, foci, and asymptotes.
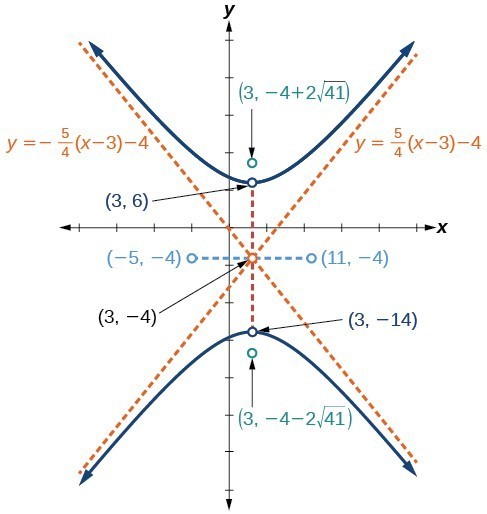
Try It
In the graph below you will find the plot of a Hyperbola not centered at the origin. Note the equation used to generate the graph is [latex]\frac{(x-h)^2}{a^2} - \frac{(y-k)^2}{b^2} = 1[/latex], and the variables [latex]a,b[/latex] are free to slide between [latex]1, 20[/latex], and the variables [latex]h,k[/latex] are free to slide between [latex]10,10[/latex]. Your task in this exercise is to use the free variables to add the following features to the graph:
- center
- vertices
- co-vertices
- foci
- asymptotes
For example, to plot the center, you would define a point like this: [latex](h,k)[/latex].
https://www.desmos.com/calculator/r307oiry1a
Candela Citations
- Revision and Adaptation. Provided by: Lumen Learning. License: CC BY: Attribution
- Graphing Hyperbolae Interactive. Authored by: Lumen Learning. Located at: https://www.desmos.com/calculator/du6j3vvisl. License: Public Domain: No Known Copyright
- Graphing Hyperbolae - With Solutions Interactive. Authored by: Lumen Learning. Located at: https://www.desmos.com/calculator/enstg1igwo. License: Public Domain: No Known Copyright
- Graphing Hyperbolae Not Centered at the Origin Interactive. Authored by: Lumen Learning. Located at: https://www.desmos.com/calculator/r307oiry1a. License: Public Domain: No Known Copyright
- Graphing Hyperbolae Not Centered at the Origin - Solutions Interactive. Authored by: Lumen Learning. Located at: https://www.desmos.com/calculator/jilkpkpse1. License: Public Domain: No Known Copyright
- College Algebra. Authored by: Abramson, Jay et al.. Provided by: OpenStax. Located at: http://cnx.org/contents/9b08c294-057f-4201-9f48-5d6ad992740d@5.2. License: CC BY: Attribution. License Terms: Download for free at http://cnx.org/contents/9b08c294-057f-4201-9f48-5d6ad992740d@5.2
- Question ID 65294. Authored by: Roberts,Janet. License: CC BY: Attribution. License Terms: IMathAS Community License CC-BY+GPL
- Precalculus. Authored by: OpenStax College. Provided by: OpenStax. Located at: http://cnx.org/contents/fd53eae1-fa23-47c7-bb1b-972349835c3c@5.175:1/Preface. License: CC BY: Attribution