Learning Objectives
- Recognize the logic behind a hypothesis test and how it relates to the P-value.
Hypothesis testing appears in all upcoming modules. The process and the logic of the hypothesis test will always be the same, but the details will differ somewhat.
Every hypothesis test will use a P-value to make a decision about the population(s). The P-value is the connection between probability and decision-making in inference. Now we discuss the P-value in more depth and relate it to our work in Linking Probability to Statistical Inference. Later we use both simulations and statistical software to find the P-value.
To develop a better understanding of the P-value, we need to return to the idea of a sampling distribution and a normal probability model. These are ideas from Linking Probability to Statistical Inference.
Example
What Is a P-value?
Let’s return to the familiar example of the 2008 presidential election. In that election, newspapers reported that Obama received 40% of the white male vote. We wonder if a smaller percentage of white males will support Obama in the 2012 election. We define the following hypotheses and conduct a hypothesis test.
- H0: The proportion of white males voting for Obama in 2012 is 0.40.
- Ha: The proportion of white males voting for Obama in 2012 is less than 0.40.
We select a random sample of 200 white male voters and find that 35% plan to vote for Obama in 2012. Clearly 35% is less than 40%. But is the difference statistically significant or due to chance? If the population proportion is 0.40, we expect to see sample proportions vary from this. But will sample proportions as small as or smaller than 0.35 occur very often? What’s the probability?
The probability (P-value) is about 0.078.
The P-value is the chance that a random sample of 200 white males will have, at most, 35% supporting Obama if 40% of this population supports Obama. This is quite a mouthful. We find that visualizing the sampling distribution helps us understand the P-value. Here is a diagram that may be helpful in interpreting the P-value.

In general, the P-value is the probability that sample results are as extreme as or more extreme than the result observed in the data if the null hypothesis is true. The phrase “as extreme as or more extreme than” means further from the center of the sampling distribution in the direction of the alternative hypothesis.
Note: You may recall the concept of a conditional probability from Relationships in Categorical Data with Intro to Probability. The P-value is a conditional probability. The condition is “the null hypothesis is true.”
Note: We can also look at the P-value in terms of error in the sample proportion. If 40% of this population support Obama, then our sample with 35% supporting Obama has a 5% error. From this perspective, the P-value is the chance that sample proportions supporting the alternative hypothesis have as much as or more error than the data. For this example, the P-value describes sample proportions less than 0.40 that deviate 0.05 or more from 0.40. This describes sample proportions at or below 0.35.
Comment
Recall in Linking Probability to Statistical Inference when we investigated the conditions that make a normal model a good fit for the sampling distribution. When a normal model is a good fit, we use it to find probabilities. In the Obama example, we can see that a normal model is a good fit for the sampling distribution, so we can find the P-value by calculating the z-score and using a simulation. Below we created a diagram to remind you how the sampling distribution relates to the standard normal model of z-scores. We will find P-values in this way in “Hypothesis Test for a Population Proportion,” but for now, we focus on what the P-value is and how to use it to make decisions.
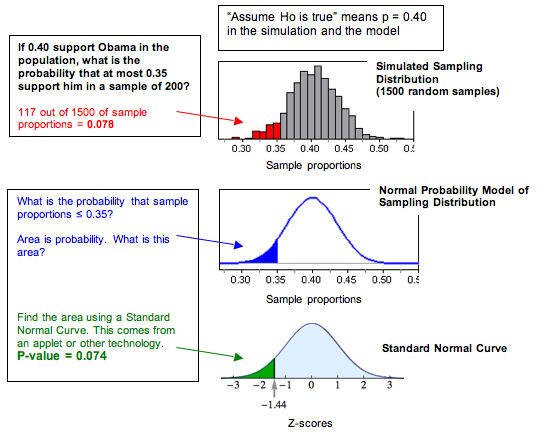
Notice that for our example , the P-value from the standard normal curve (0.074) is not exactly equal to the relative frequency in the simulated sampling distribution (0.078), but it is close. Both of these values represent estimates of the probability we want.
In hypothesis testing you use the standard normal curve (or a similar model) to find P-values. For this reason, you will frequently see the P-value defined in terms of the “test statistic,” which is the z-score in our example. Here is a common definition: The P-value is the probability of obtaining a test statistic at least as extreme as the one that was actually observed, assuming the null hypothesis is true.
Learn By Doing
Learn By Doing
Comment
The purpose of the hypothesis test is to describe the degree of evidence that the sample provides against the null hypothesis. The P-value does this job. In the next two activities, we do not give a P-value. We want you to practice visualizing the sampling distribution to identify the most convincing evidence against the null hypothesis. This type of visualization is important to understanding the ideas we discuss on this page.
Example
More on Using the P-Value to Make a Decision
Let’s finish the hypothesis test about white male support for Obama.
- H0: The proportion of white males voting for Obama in 2012 is 0.40.
- Ha: The proportion of white males voting for Obama in 2012 is less than 0.40.
Recall our random sample of 200 white male voters with 35% planning to vote for Obama in 2012. Clearly 35% is less than 40%, but is the difference statistically significant or due to chance?
The probability (P-value) is about 0.078. What can we conclude? A small P-value indicates that the data are unlikely to occur in random sampling from a population in which the null hypothesis is true. So the smaller the P-value, the stronger the evidence is against the null hypothesis.
Do you view something that happens 7.8% of the time as “unlikely”? This is a judgment call. There is no right or wrong answer. Because this is a judgment call, we will often agree to a definition of “unlikely” before we run the test. This is the significance level, α. The significance level is a benchmark for how small the P-value must be in order for us to say results are statistically significant. It gives us a cutoff point for rejecting the null hypothesis. Here are the decision-making rules that we gave earlier.
If the P-value ≤ α, we reject the null hypothesis in favor of the alternative hypothesis.
If the P-value > α, we fail to reject the null hypothesis.
Why do these “rules” make sense? Again, we think that visualizing a simulation of the sampling distribution is helpful.
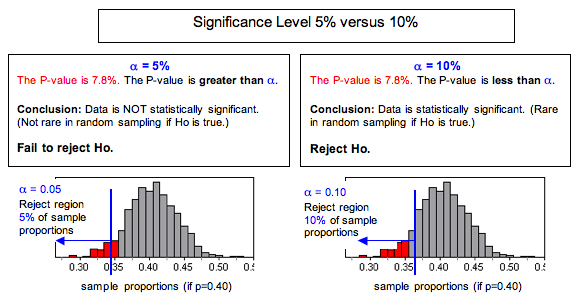
Keep in mind that all of the sample proportions in the simulation did actually occur when we selected random samples from a population with P = 0.40. Results less than 0.40 support the alternative hypothesis but to varying degrees. To provide enough evidence to reject the null hypothesis and accept the alternative hypothesis, results have to be smaller than 0.40 and “rare.” When we set the significance level at 5% (α = 0.05), we agree to view results that occur less than 5% of the time as “rare enough” to question whether the sample came from the population described by the null. So we reject the null hypothesis and accept the alternative. If we set the significance level at 10% (α = 0.10), we have changed the definition of rare. As you can see, different significance levels can lead to different conclusions.
Here are our conclusions for the two different levels of significance.
At the 5% level, our poll results are not statistically significant (P-value = 0.078). We conclude that white male support for Obama will not be less than 40% in 2012. (Note: This statement says we do not have enough evidence to accept Ha. Because Ha is related to the claim or hunch that motivated our investigation, we state our conclusion in terms of Ha.)
At the 10% level, our poll results are statistically significant (P-value = 0.078). We conclude that white male support for Obama will be less than 40% in 2012. (Note: This statement says we have enough evidence to accept Ha. Again, the conclusion is stated in terms of Ha.)
How Do You Choose a Level of Significance?
Remember that the purpose of the hypothesis test is to describe the degree of evidence that the sample provides against the null hypothesis. The P-value does this. How small a P-value is convincing evidence? It depends on the situation and the opinions of the people who use the hypothesis test to make a decision. If rejecting the null hypothesis will be controversial or expensive, then the users of the test results may want to use a smaller level of significance than we did. For this reason, we always report the P-value with our conclusions so that the people who use the results of the test can determine if the P-value is strong enough evidence for their purpose.
Later we discuss other considerations for choosing a level of significance.
Learn By Doing
Candela Citations
- Concepts in Statistics. Provided by: Open Learning Initiative. Located at: http://oli.cmu.edu. License: CC BY: Attribution