Learning Objectives
- For an observational study, critique the sampling plan. Recognize implications and limitations of the plan.
Let’s briefly summarize the main points about sampling:
- We draw a conclusion about the population on the basis of the sample.
- To draw a valid conclusion, the sample must be representative of the population. A representative sample is a subset of the population that reflects the characteristics of the population.
- A sample is biased if it systematically favors a certain outcome.
- Random selection eliminates bias.
We have not mentioned the size of the sample. Are larger samples more accurate? Well, the answer is yes and no.
Recall the 1936 presidential election. A sample of over 2 million people did not correctly identify the winner of the election. Two million people is a huge sample, yet the results were completely wrong. So a large sample does not guarantee reliable results.
However, if the samples are randomly selected, then size does matter. We see this in the next example.
Example
For Random Samples, Size Matters
Let’s compare the accuracy of random samples of different sizes.
Suppose there are 10,000 students at your college. Also suppose that 65% of these students are eligible for financial aid. How accurate are random samples at predicting this population value?
To answer this question, we randomly select 50 students and determine the proportion who are eligible for financial aid. We repeat this several times. Here are the results for three random samples:

Notice that each random sample has a different result. Some results are larger than the true population value of 65%; some results are smaller than the true population value. Because there is no bias in random samples, we expect results above and below the true value to occur with similar frequency.
Now we use a simulation to take many more random samples. Again, each sample is composed of 50 randomly selected people. Here is a dotplot of the proportion who are eligible for financial aid in 100 samples. Each dot is a random sample.

We see that the results from random samples vary from 0.48 to 0.80. Typical values range from about 0.58 to 0.74.
Note: Many samples have results below the true population value of 0.65, and many have results above 0.65. This shows that random samples are not biased. For the question Are you eligible for financial aid?, there is no systematic favoring of one response over another. The samples are representative of the population.
What happens when we increase the number of people in the random sample?
We increased the number of people in each sample to 250. Here is dotplot of the results from 100 of these larger random samples.
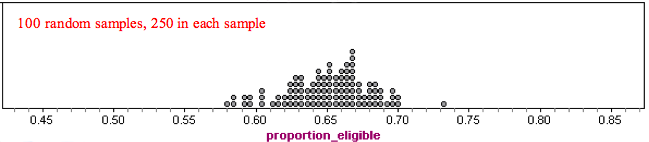
Notice there is less variability in these larger samples. Results range from about 0.58 to 0.73. Typical values range from about 0.62 to 0.68. These samples give results that are closer to the true population value of 0.65.
So what’s the point? Larger samples tend to be more accurate than smaller samples if the samples are chosen randomly.
Comment
The precision of the sample results depends on the size of the sample, not the size of the population. The following dotplots illustrate this point. Here we selected samples with 250 people in each sample, but we varied the size of the population. Each dotplot contains 100 samples.
Notice that the sample results look very similar. For each population, the sample results fall between about 0.58 and 0.73. In each graph, it is common for sample results to fall between about 0.62 and 0.68.
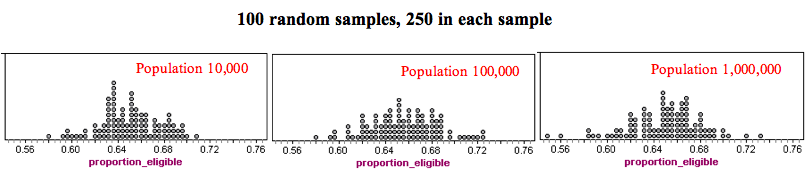
What’s the main point? The size of the population does not affect the accuracy of a random sample as long as the population is large.
Learn By Doing
Comment
If an attempt is made to include every individual from a population in a sample, then the investigation is called a census. Every 10 years, the U.S. Census Bureau conducts a population census. It attempts to collect information about every person living in the United States. However, the population census misses between 1% and 3% of the U.S. population and accidentally counts some people more than once. A full census is possible only for small populations.
Let’s Summarize
- We draw a conclusion about the population on the basis of the sample.
- To draw a valid conclusion, the sample must be representative of the population. A representative sample is a subset of the population. It also reflects the characteristics of the population.
- A sample is biased if it systematically favors a certain outcome.
- Random selection eliminates bias.
- Larger samples tend to be more accurate than smaller samples if the samples are chosen randomly.
- The size of the population does not affect the accuracy of a random sample as long as the population is large.
- If an attempt is made to include every individual from a population in a sample, then the investigation is called a census.
Candela Citations
- Concepts in Statistics. Provided by: Open Learning Initiative. Located at: http://oli.cmu.edu. License: CC BY: Attribution