Learning Outcomes
- Identify the vertex, axis of symmetry, [latex]y[/latex]-intercept, and minimum or maximum value of a parabola from it’s graph.
- Identify a quadratic function written in general and vertex form.
- Given a quadratic function in general form, find the vertex.
- Define the domain and range of a quadratic function by identifying the vertex as a maximum or minimum.
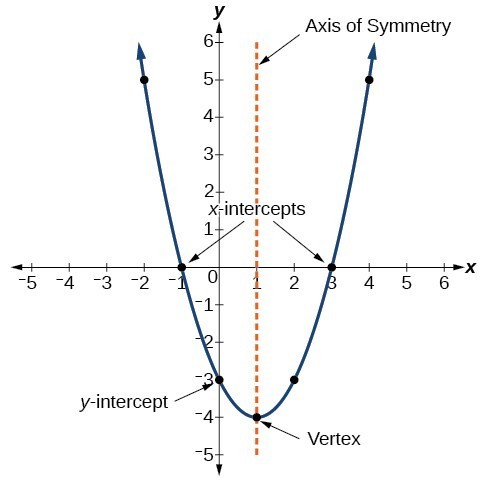
The graph of a quadratic function is a U-shaped curve called a parabola. One important feature of the graph is that it has an extreme point, called the vertex. If the parabola opens up, the vertex represents the lowest point on the graph, or the minimum value of the quadratic function. If the parabola opens down, the vertex represents the highest point on the graph, or the maximum value. In either case, the vertex is a turning point on the graph. The graph is also symmetric with a vertical line drawn through the vertex, called the axis of symmetry.

The [latex]y[/latex]-intercept is the point at which the parabola crosses the [latex]y[/latex]-axis. The [latex]x[/latex]-intercepts are the points at which the parabola crosses the [latex]x[/latex]-axis. If they exist, the [latex]x[/latex]-intercepts represent the zeros, or roots, of the quadratic function, the values of [latex]x[/latex] at which [latex]y=0[/latex].
tip for success
The places where a function’s graph crosses the horizontal axis are the places where the function value equals zero. You’ve seen that these values are called horizontal intercepts, x-intercepts, and zeros so far. They can also be referred to as the roots of a function.
Example: Identifying the Characteristics of a Parabola
Determine the vertex, axis of symmetry, zeros, and y-intercept of the parabola shown below.

Try It
Use a graphing calculator to help you solve the question below. Here is a link to an online graphing calculator. Desmos | Graphing Calculator
Here is a video showing how to find the components of the graph of a parabola using a TI-84 graphing calculator.
Equations of Quadratic Functions
The general form of a quadratic function presents the function in the form
[latex]f\left(x\right)=a{x}^{2}+bx+c[/latex]
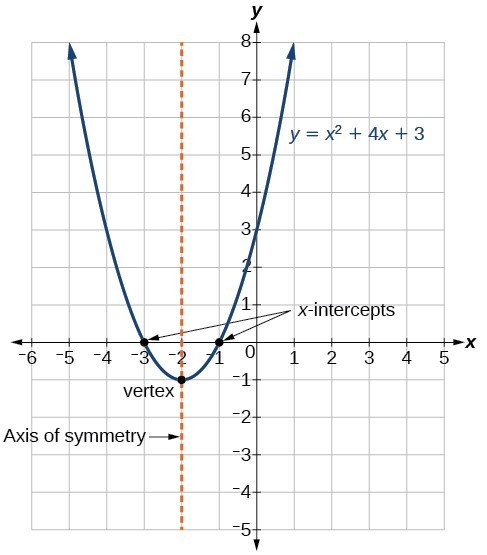
where [latex]a[/latex], [latex]b[/latex], and [latex]c[/latex] are real numbers and [latex]a\ne 0[/latex]. If [latex]a>0[/latex], the parabola opens upward. If [latex]a<0[/latex], the parabola opens downward. We can use the general form of a parabola to find the equation for the axis of symmetry. The axis of symmetry is defined by [latex]x=-\dfrac{b}{2a}[/latex]. If we use the quadratic formula, [latex]x=\dfrac{-b\pm \sqrt{{b}^{2}-4ac}}{2a}[/latex], to solve [latex]a{x}^{2}+bx+c=0[/latex] for the [latex]x[/latex]-intercepts, or zeros, we find the value of [latex]x[/latex] halfway between them is always [latex]x=-\dfrac{b}{2a}[/latex], the equation for the axis of symmetry. The figure below shows the graph of the quadratic function written in general form as [latex]y={x}^{2}+4x+3[/latex]. In this form, [latex]a=1,\text{ }b=4[/latex], and [latex]c=3[/latex]. Because [latex]a>0[/latex], the parabola opens upward. The axis of symmetry is [latex]x=-\dfrac{4}{2\left(1\right)}=-2[/latex]. This also makes sense because we can see from the graph that the vertical line [latex]x=-2[/latex] divides the graph in half. The vertex always occurs along the axis of symmetry. For a parabola that opens upward, the vertex occurs at the lowest point on the graph, in this instance, [latex]\left(-2,-1\right)[/latex]. The [latex]x[/latex]-intercepts, those points where the parabola crosses the [latex]x[/latex]-axis, occur at [latex]\left(-3,0\right)[/latex] and [latex]\left(-1,0\right)[/latex].

The standard form of a quadratic function presents the function in the form
[latex]f\left(x\right)=a{\left(x-h\right)}^{2}+k[/latex]
where [latex]\left(h,\text{ }k\right)[/latex] is the vertex. Because the vertex appears in the standard form of the quadratic function, this form is also known as the vertex form of a quadratic function.
This desmos activity is for the Try It that follows.
Try It
Using the desmos activity above, plot the function [latex]f\left(x\right)=2\left(x-h\right)^2+k[/latex].
Moving the sliders change the values of [latex]h[/latex] and [latex]k[/latex] to examine how changing the location of the vertex [latex](h,k)[/latex] of a parabola also changes the axis of symmetry. Notice that when you move [latex]k[/latex] independently of [latex]h[/latex], you are only moving the vertical location of the vertex. Experiment with values between [latex]-10[/latex] and [latex]10[/latex].
The vertex of a parabola is the location of either the maximum or minimum value of the parabola. If [latex]a>0[/latex], the parabola opens upward and the parabola has a minimum value of [latex]k[/latex] at [latex]x=h[/latex]. If [latex]a<0[/latex], the parabola opens downward, and the parabola has a maximum value of [latex]k[/latex] at [latex]x=h[/latex]. In this case, the vertex is the location of the minimum value of the function because [latex]a=2[/latex].
Given a quadratic function in general form, find the vertex of the parabola.
One reason we may want to identify the vertex of the parabola is that this point will inform us where the maximum or minimum value of the output occurs, [latex]k[/latex], and where it occurs, [latex]h[/latex]. If we are given the general form of a quadratic function:
[latex]f(x)=ax^2+bx+c[/latex]
We can define the vertex, [latex](h,k)[/latex], by doing the following:
- Identify [latex]a[/latex], [latex]b[/latex], and [latex]c[/latex].
- Find [latex]h[/latex], the [latex]x[/latex]-coordinate of the vertex, by substituting [latex]a[/latex] and [latex]b[/latex] into [latex]h=-\dfrac{b}{2a}[/latex].
- Find [latex]k[/latex], the [latex]y[/latex]-coordinate of the vertex, by evaluating [latex]k=f\left(h\right)=f\left(-\dfrac{b}{2a}\right)[/latex]
Example: Finding the Vertex of a Quadratic Function
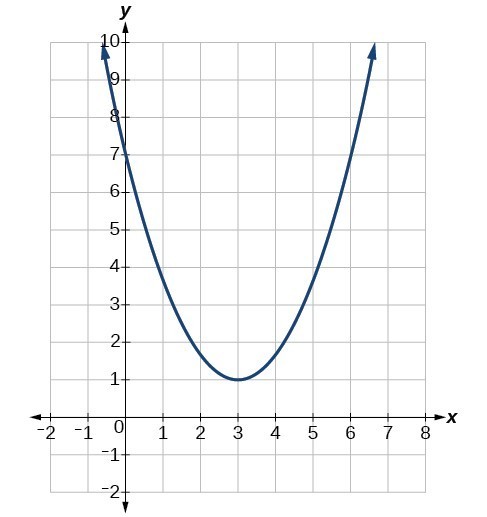
Find the vertex of the quadratic function [latex]f\left(x\right)=2{x}^{2}-6x+7[/latex]. Rewrite the quadratic in standard form (vertex form).
Try It
Given the equation [latex]g\left(x\right)=13+{x}^{2}-6x[/latex], write the equation in general form and then in standard form.
Finding the Domain and Range of a Quadratic Function
Any number can be the input value of a quadratic function. Therefore the domain of any quadratic function is all real numbers. Because parabolas have a maximum or a minimum at the vertex, the range is restricted. Since the vertex of a parabola will be either a maximum or a minimum, the range will consist of all [latex]y[/latex]-values greater than or equal to the [latex]y[/latex]-coordinate of the vertex or less than or equal to the [latex]y[/latex]-coordinate at the turning point, depending on whether the parabola opens up or down.
A General Note: Domain and Range of a Quadratic Function
The domain of any quadratic function is all real numbers.
The range of a quadratic function written in general form [latex]f\left(x\right)=a{x}^{2}+bx+c[/latex] with a positive [latex]a[/latex] value is [latex]f\left(x\right)\ge f\left(-\frac{b}{2a}\right)[/latex], or [latex]\left[f\left(-\frac{b}{2a}\right),\infty \right)[/latex]; the range of a quadratic function written in general form with a negative [latex]a[/latex] value is [latex]f\left(x\right)\le f\left(-\frac{b}{2a}\right)[/latex], or [latex]\left(-\infty ,f\left(-\frac{b}{2a}\right)\right][/latex].
The range of a quadratic function written in standard form [latex]f\left(x\right)=a{\left(x-h\right)}^{2}+k[/latex] with a positive [latex]a[/latex] value is [latex]f\left(x\right)\ge k[/latex]; the range of a quadratic function written in standard form with a negative [latex]a[/latex] value is [latex]f\left(x\right)\le k[/latex].
How To: Given a quadratic function, find the domain and range.
- The domain of any quadratic function as all real numbers.
- Determine whether [latex]a[/latex] is positive or negative. If [latex]a[/latex] is positive, the parabola has a minimum. If [latex]a[/latex] is negative, the parabola has a maximum.
- Determine the maximum or minimum value of the parabola, [latex]k[/latex].
- If the parabola has a minimum, the range is given by [latex]f\left(x\right)\ge k[/latex], or [latex]\left[k,\infty \right)[/latex]. If the parabola has a maximum, the range is given by [latex]f\left(x\right)\le k[/latex], or [latex]\left(-\infty ,k\right][/latex].
Example: Finding the Domain and Range of a Quadratic Function
Find the domain and range of [latex]f\left(x\right)=-5{x}^{2}+9x - 1[/latex].
Try It
Find the domain and range of [latex]f\left(x\right)=2{\left(x-\dfrac{4}{7}\right)}^{2}+\dfrac{8}{11}[/latex].
Candela Citations
- Question ID 120303. Authored by: Lumen Learning. License: CC BY: Attribution. License Terms: IMathAS Community License CC-BY + GPL
- Question ID 120300. Authored by: Lumen Learning. License: CC BY: Attribution. License Terms: IMathAS Community License CC-BY + GPL
- Revision and Adaptation. Provided by: Lumen Learning. License: CC BY: Attribution
- Vertex and Axis of Symmetry Interactive. Authored by: Lumen Learning. Located at: https://www.desmos.com/calculator/q3e3ymnpnn. License: Public Domain: No Known Copyright
- College Algebra. Authored by: Abramson, Jay et al.. Provided by: OpenStax. Located at: http://cnx.org/contents/9b08c294-057f-4201-9f48-5d6ad992740d@5.2. License: CC BY: Attribution. License Terms: Download for free at http://cnx.org/contents/9b08c294-057f-4201-9f48-5d6ad992740d@5.2