India is the second most populous country in the world with a population of about 1.25 billion people in 2013. The population is growing at a rate of about 1.2% each year.[1] If this rate continues, the population of India will exceed China’s population by the year 2031. When populations grow rapidly, we often say that the growth is “exponential.” To a mathematician, however, the term exponential growth has a very specific meaning. In this section, we will take a look at exponential functions, which model this kind of rapid growth.
XXXXXXXXXXXXXXXXXXXXXXX
Now we will turn our attention to the function representing the number of stores for Company B, [latex]B\left(x\right)=100{\left(1+0.5\right)}^{x}[/latex]. In this exponential function, 100 represents the initial number of stores, 0.5 represents the growth rate, and [latex]1+0.5=1.5[/latex] represents the growth factor. Generalizing further, we can write this function as [latex]B\left(x\right)=100{\left(1.5\right)}^{x}[/latex] where 100 is the initial value, 1.5 is called the base, and x is called the exponent.
Example: Evaluating a Real-World Exponential Model
At the beginning of this section, we learned that the population of India was about 1.25 billion in the year 2013 with an annual growth rate of about 1.2%. This situation is represented by the growth function [latex]P\left(t\right)=1.25{\left(1.012\right)}^{t}[/latex] where t is the number of years since 2013. To the nearest thousandth, what will the population of India be in 2031?
Try It
The population of China was about 1.39 billion in the year 2013 with an annual growth rate of about 0.6%. This situation is represented by the growth function [latex]P\left(t\right)=1.39{\left(1.006\right)}^{t}[/latex] where t is the number of years since 2013. To the nearest thousandth, what will the population of China be in the year 2031? How does this compare to the population prediction we made for India in the previous example?
XXXXXXXXXXXXXXXXXXXXXXX
As we saw earlier, the amount earned on an account increases as the compounding frequency increases. The table below shows that the increase from annual to semi-annual compounding is larger than the increase from monthly to daily compounding. This might lead us to ask whether this pattern will continue.
Examine the value of $1 invested at 100% interest for 1 year compounded at various frequencies.
| Frequency | [latex]A\left(t\right)={\left(1+\frac{1}{n}\right)}^{n}[/latex] | Value |
|---|---|---|
| Annually | [latex]{\left(1+\frac{1}{1}\right)}^{1}[/latex] | $2 |
| Semiannually | [latex]{\left(1+\frac{1}{2}\right)}^{2}[/latex] | $2.25 |
| Quarterly | [latex]{\left(1+\frac{1}{4}\right)}^{4}[/latex] | $2.441406 |
| Monthly | [latex]{\left(1+\frac{1}{12}\right)}^{12}[/latex] | $2.613035 |
| Daily | [latex]{\left(1+\frac{1}{365}\right)}^{365}[/latex] | $2.714567 |
| Hourly | [latex]{\left(1+\frac{1}{\text{8766}}\right)}^{\text{8766}}[/latex] | $2.718127 |
| Once per minute | [latex]{\left(1+\frac{1}{\text{525960}}\right)}^{\text{525960}}[/latex] | $2.718279 |
| Once per second | [latex]{\left(1+\frac{1}{31557600}\right)}^{31557600}[/latex] | $2.718282 |
These values appear to be approaching a limit as n increases without bound. In fact, as n gets larger and larger, the expression [latex]{\left(1+\frac{1}{n}\right)}^{n}[/latex] approaches a number used so frequently in mathematics that it has its own name: the letter [latex]e[/latex]. This value is an irrational number, which means that its decimal expansion goes on forever without repeating. Its approximation to six decimal places is shown below.
XXXXXXXXXXXXXXXXXXXXXXXXXXXXXXXXXXXXXX
Example: Writing an Exponential Model When the Initial Value Is Known
In 2006, 80 deer were introduced into a wildlife refuge. By 2012, the population had grown to 180 deer. The population was growing exponentially. Write an algebraic function N(t) representing the population N of deer over time t.

Try It
A wolf population is growing exponentially. In 2011, 129 wolves were counted. By 2013 the population had reached 236 wolves. What two points can be used to derive an exponential equation modeling this situation? Write the equation representing the population N of wolves over time t.
XXXXXXXXXXXXXXXXXXXXXXXXXXXXXXXXXXXXXX
Equations of Exponential Functions
In the previous examples, we were given an exponential function which we then evaluated for a given input. Sometimes we are given information about an exponential function without knowing the function explicitly. We must use the information to first write the form of the function, determine the constants a and b, and evaluate the function.
How To: Given two data points, write an exponential model
-
- If one of the data points has the form [latex]\left(0,a\right)[/latex], then a is the initial value. Using a, substitute the second point into the equation [latex]f\left(x\right)=a{b}^{x}[/latex], and solve for b.
- If neither of the data points have the form [latex]\left(0,a\right)[/latex], substitute both points into two equations with the form [latex]f\left(x\right)=a{b}^{x}[/latex]. Solve the resulting system of two equations to find [latex]a[/latex] and [latex]b[/latex].
- Using the a and b found in the steps above, write the exponential function in the form [latex]f\left(x\right)=a{b}^{x}[/latex].
Example: Writing an Exponential Model When the Initial Value is Not Known
Find an exponential function that passes through the points [latex]\left(-2,6\right)[/latex] and [latex]\left(2,1\right)[/latex].

Try It
Given the two points [latex]\left(1,3\right)[/latex] and [latex]\left(2,4.5\right)[/latex], find the equation of the exponential function that passes through these two points.
Q & A
Do two points always determine a unique exponential function?
Yes, provided the two points are either both above the x-axis or both below the x-axis and have different x-coordinates. But keep in mind that we also need to know that the graph is, in fact, an exponential function. Not every graph that looks exponential really is exponential. We need to know the graph is based on a model that shows the same percent growth with each unit increase in x, which in many real world cases involves time.
How To: Given the graph of an exponential function, write its equation
- First, identify two points on the graph. Choose the y-intercept as one of the two points whenever possible. Try to choose points that are as far apart as possible to reduce round-off error.
- If one of the data points is the y-intercept [latex]\left(0,a\right)[/latex] , then a is the initial value. Using a, substitute the second point into the equation [latex]f\left(x\right)=a{b}^{x}[/latex] and solve for b.
- If neither of the data points have the form [latex]\left(0,a\right)[/latex], substitute both points into two equations with the form [latex]f\left(x\right)=a{b}^{x}[/latex]. Solve the resulting system of two equations to find a and b.
- Write the exponential function, [latex]f\left(x\right)=a{b}^{x}[/latex].
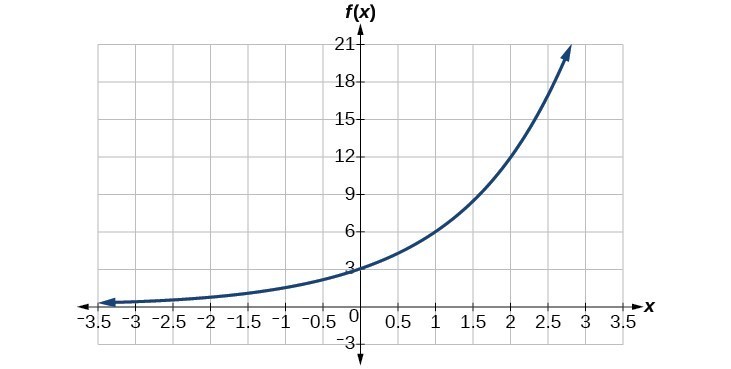
Example: Writing an Exponential Function Given Its Graph
Find an equation for the exponential function graphed below.
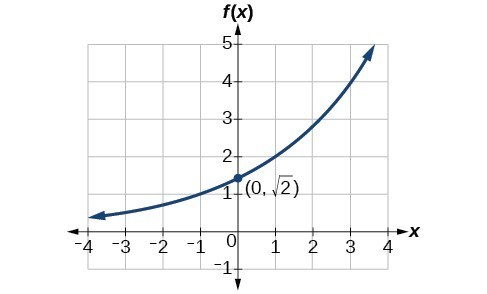
Try It
Find an equation for the exponential function graphed below.
- http://www.worldometers.info/world-population/. Accessed February 24, 2014. ↵