| Employee | Monthly Salary in January
(in thousands of dollars) |
| Employee 1 | 4 |
| Employee 2 | 6 |
| Employee 3 | 3 |
| Employee 4 | 5 |
| Employee 5 | 6 |
| Employee 6 | 3 |
| Employee | Monthly Salary in February
(in thousands of dollars) |
| Employee 1 | 4 |
| Employee 2 | 8 |
| Employee 3 | 3 |
| Employee 4 | 5 |
| Employee 5 | 6 |
| Employee 6 | 3 |
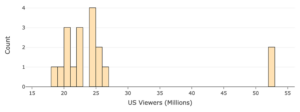
| Episode Number | Episode Title | Air Date | U.S. Viewers (Millions) |
| 1 | The One After Joey and Rachel Kiss | 9/25/03 | 24.54 |
| 2 | The One Where Ross Is Fine | 10/2/03 | 22.38 |
| 3 | The One with Ross’s Tan | 10/9/03 | 21.87 |
| 4 | The One with the Cake | 10/23/03 | 18.77 |
| 5 | The One Where Rachel’s Sister Babysits | 10/30/03 | 19.37 |
| 6 | The One with Ross’s Grant | 11/6/03 | 20.38 |
| 7 | The One with the Home Study | 11/13/03 | 20.21 |
| 8 | The One with the Late Thanksgiving | 11/20/03 | 20.66 |
| 9 | The One with the Birth Mother | 1/8/04 | 25.49 |
| 10 | The One Where Chandler Gets Caught | 1/15/04 | 26.68 |
| 11 | The One Where the Stripper Cries | 2/5/04 | 24.91 |
| 12 | The One with Phoebe’s Wedding | 2/12/04 | 25.9 |
| 13 | The One Where Joey Speaks French | 2/19/04 | 24.27 |
| 14 | The One with Princess Consuela | 2/26/04 | 22.83 |
| 15 | The One Where Estelle Dies | 4/22/04 | 22.64 |
| 16 | The One with Rachel’s Going Away Party | 4/29/04 | 24.51 |
| 17 | The Last One | 5/6/04 | 52.46 |
| 18 | The Last One | 5/6/04 | 52.46 |
| Plot | Distribution | Mean and Median |
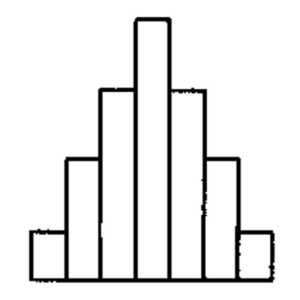
Credit: Skew the Script |
a) Left-skewed
b) Symmetric c) Right-skewed |
The mean is ________ the median.
a) greater than b) less than c) roughly equal to |
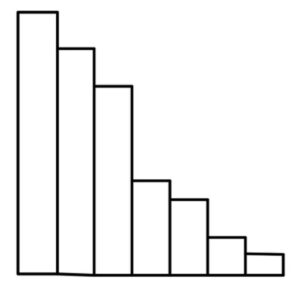 |
a) Left-skewed
b) Symmetric c) Right-skewed |
The mean is ________ the median.
a) greater than b) less than c) roughly equal to |
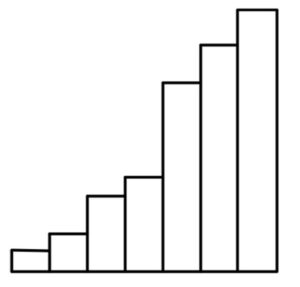 |
a) Left-skewed
b) Symmetric c) Right-skewed |
The mean is ________ the median.
a) greater than b) less than c) roughly equal to |
| Skill or Concept: I can . . . | Questions to check your understanding | Rating from 1 to 5 |
| Calculate the median of a dataset. | 1, Part A | |
| Calculate the mean of a dataset. | 2, Part A | |
| Interpret the median of a dataset. | 1, Part B | |
| Interpret the mean of a dataset. | 2, Part B | |
| Use the terms “left skewed,” “right skewed,” “symmetric,” and “outlier” to describe the features of a dataset. | 4, Part A
7, 8 |
|
| Make connections between the distribution of a dataset and how the mean and median relate. | 3–7 |

 Glossary
- right-skewed (positive skew)
- most of the data is bunched up to the left of the graph with a “tail” of infrequent values on the right (upper) end of the distribution.
- symmetric
- a distribution where the values are similarly distributed on either side of the mean/median.
- left-skewed (negative skew)
- most of the data is bunched up to the right of the graph with a “tail” of infrequent values on the left (lower) end of the distribution.
- resistant
- not affected by the skewness of a graph.
- outlier
- an unusual or extreme value, given the other values in the dataset.
