| Skill or Concept: I can . . . | Questions to check your understanding | Rating from 1 to 5 |
| Infer the type of dataset used to create a graphical display. | 1, 3, 4 | |
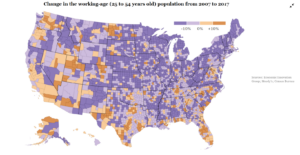
| Identify the scale/color used in a graphical display. | 5, 6 | |
| Identify the data source for a graphical display. | 2 | |
| Recognize an accurate interpretation of a graphical display. | 7 | |
| Write a statement about interpreting a graphical display. | 8 |


| Winter | Spring | Summer | Autumn | |
| New York | 39˚ | 64˚ | 84˚ | 55˚ |
| Los Angeles | 68˚ | 73˚ | 83˚ | 79˚ |
| Chicago | 25˚ | 56 ˚ | 75˚ | 50˚ |
| Houston | 60˚ | 76˚ | 91˚ | 75˚ |
Glossary
- heat map
- a representation of data in the form of a map or diagram where data values are grouped into different colors.
