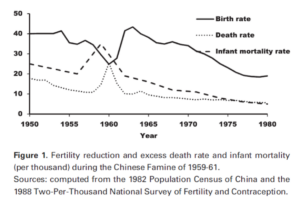
Figure 1. Fertility reduction and excess death rate and infant mortality (per thousand) during the Chinese Famine of 1959-61. Sources: computed from the 1982 Population Census of China and the 1988 Two-Per-Thousand National Survey of Fertility and Contraception.


| Skill or Concept: I can . . . | Questions to check your understanding | Rating from 1 to 5 |
| Identify evidence of design. | 1 | |
| Identify evidence of precision. | 2 | |
| Identify evidence of efficiency. | 3 | |
| Identify evidence of use of time, use of space, and use of ink. | 4, 5 | |
| Identify evidence of multivariate. | 6–10 |


Glossary 5C
- design
- use of attributes such as color, symbols, or lines/curves to encourage comparisons that create a clear purpose for the graphical display.
- precision
- use of appropriate statistical transformations for the type of visualization.
- efficiency
- requiring minimal effort for the reader to understand the purpose of the graphical display
- multivariate
- displaying more than one variable on a graphical display to encourage the reader to make comparisons.
