| Student First Name | Midterm Score
(out of 50 points) |
Final Exam Score
(out of 100 points) |
| Joe | 42 | 64 |
| Barak | 52 | 94 |
| Hillary | 44 | 87 |
| Donald | 25 | 46 |
| Cher | 41 | 73 |
| Katy | 39 | 73 |
| Taylor | 33 | 53 |
| Miley | 40 | 77 |
| Justin | 35 | 60 |
| Snoop | 31 | 62 |
| Bruno | 37 | 71 |
| Kanye | 49 | 95 |
| Leonardo | 38 | 70 |
| Rosie | 45 | 80 |
| Maya | 49 | 80 |
| Tyra | 48 | 82 |
| Selena | 50 | 81 |
| Body mass (g) | TOV
(cm per second) |
| 3640 | 334.5 |
| 2670 | 387.3 |
| 5600 | 410.8 |
| 4130 | 318.6 |
| 3020 | 368.7 |
| 2660 | 358.8 |
| 3240 | 344.6 |
| 5140 | 324.6 |
| 3690 | 301.4 |
| 3620 | 331.8 |
| 5310 | 312.6 |
| 5560 | 316.8 |
| 3970 | 375.6 |
| 3770 | 372.4 |
| 5100 | 314.3 |
| 2950 | 367.5 |
| 7930 | 286.3 |
| Week | Kai’s weight |
| 0 | 173 |
| 1 | 171 |
| 2 | |
| 3 | |
| 4 | |
| 5 | |
| 6 |
| Chirps per second | Temperature in degrees Fahrenheit |
| 20 | 88.6 |
| 16 | 71.6 |
| 19.8 | 93.3 |
| 18.4 | 84.3 |
| 17.1 | 80.6 |
| 15.5 | 75.2 |
| 14.7 | 69.7 |
| 17.1 | 82 |
| 15.4 | 69.4 |
| 16.2 | 83.3 |
| 15 | 79.6 |
| 17.2 | 82.6 |
| 16 | 80.6 |
| 17 | 83.5 |
| 14.4 | 76.3 |
| Skill or Concept: I can . . . | Questions to check your understanding | Rating from 1 to 5 |
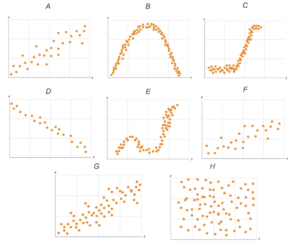
| Identify when a linear regression analysis might be appropriate. | 3, 4, 5 (Part A) | |
| Identify the explanatory and response variables in a given scenario. | 1, 2, 5 (Parts B and C) | |
| Calculate the line of best fit and write it using proper notation. | 5 (Parts D through F) |


Glossary
- Least Squares Regression (LSR) analysis
- determining the equation of a line of best fit to make predictions based on an existing dataset, also be described as linear modeling.
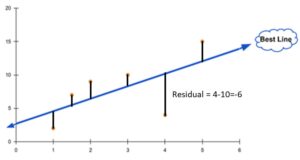
- residual
- a representation of how far off a prediction calculated from the line is compared to the actual, observed 𝑦 value, illustrated by a vertical line; also called vertical error.
