| x | y |
| 0 | 100 |
| 1 | 103 |
| 2 | 106 |
| 3 | 109 |
| x | y |
| 2 | 1 |
| 0 | 3 |
| 2 | 5 |
| 4 | 7 |
| Skill or Concept: I can . . . | Questions to check your understanding | Rating from 1 to 5 |
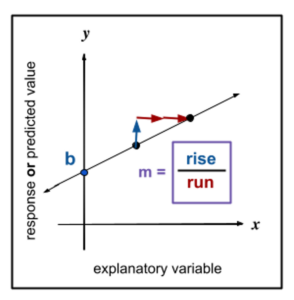
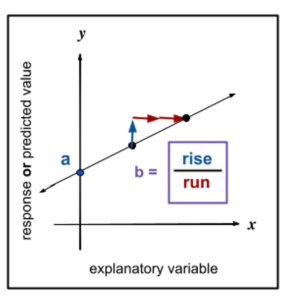
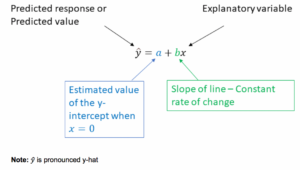
| Identify the estimated y-intercept and estimated slope from the equation of the line. | 1–3 | |
| Interpret the estimated slope in context. | 4, 5 |
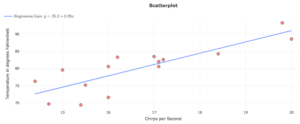
| Chirps per second | Temperature (in oF) |
| 20 | 88.6 |
| 16 | 71.6 |
| 19.8 | 93.3 |
| 18.4 | 84.3 |
| 17.1 | 80.6 |
| 15.5 | 75.2 |
| 14.7 | 69.7 |
| 17.1 | 82 |
| 15.4 | 69.4 |
| 16.2 | 83.3 |
| 15 | 79.6 |
| 17.2 | 82.6 |
| 16 | 80.6 |
| 17 | 83.5 |
| 14.4 | 76.3 |
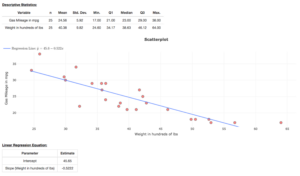
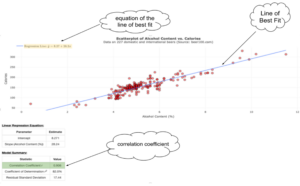
Linear Regression Equation:
| Parameter | Estimate |
| Intercept | 25.23 |
| Slope (Chirps per Second) | 3.291 |
Model Summary:
| Statistic | Value |
| Correlation Coefficient r | 0.835 |
| Coefficient of Determination r^2 | 69.7% |
| Residual Standard Deviation | 3.829 |
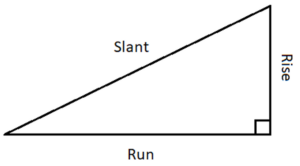
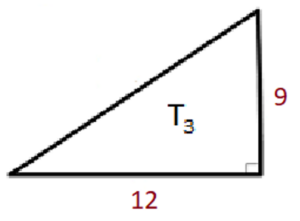

Glossary
- right triangle
- a triangle that contains one right angle (90 degrees).
- base
- the horizontal side of a right triangle.
