| Skill or Concept: I can . . . | Questions to check your understanding | Rating from 1 to 5 |
| Identify the explanatory and response variables for a given scenario. | 1 | |
| Use technology to make a scatterplot. | 2 | |
| Use a scatterplot to describe bivariate relationships. | 2 | |
| Approximate predicted values from a scatterplot. | 3, 4 | |
| Use technology to calculate a line of best fit. | 5, Part A | |
| Interpret the slope and intercept. | 5, Parts B and C | |
| Calculate predictions using the line of best fit and assess reliability of the predictions. | 5, Parts D through F |
| Sex | Bwt | Hwt |
| F | 2 | 7 |
| F | 2 | 7.4 |
| F | 2 | 9.5 |
| F | 2.1 | 7.2 |
| F | 2.1 | 7.3 |
| F | 2.1 | 7.6 |
| F | 2.1 | 8.1 |
| F | 2.1 | 8.2 |
| F | 2.1 | 8.3 |
| F | 2.1 | 8.5 |
| Movie | Tomatometer |
| Aladdin (2019) | 57 |
| Fantastic Four (2015) | 9 |
| Parasite | 98 |
| The Grinch | 58 |
| Avengers: Age of Ultron | 75 |
| Chaos Walking | 22 |
| Movie | Tomatometer | Predicted audience score |
| Aladdin (2019) | ||
| Parasite | ||
| The Grinch | ||
| Avengers: Age of Ultron | ||
| Chaos Walking |
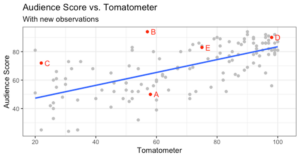
| Movie | Tomatometer | Audience score | Letter on scatterplot |
| Aladdin (2019) | 57 | 94 | |
| Parasite | 98 | 90 | |
| The Grinch | 58 | 50 | |
| Avengers: Age of Ultron | 75 | 83 | |
| Chaos Walking | 22 | 72 |

| Physical Activity = No | Physical Activity = Yes |
| Systolic Blood Pressure | Systolic Blood Pressure |
| 139 | 115 |
| 150 | 118 |
| 100 | 97 |
| 132 | 111 |
| 122 | 110 |
| 121 | 118 |
| 108 | 118 |
| 104 | 129 |
| 133 | 114 |
| 129 | 113 |
| 104 | 127 |
| 129 | 124 |
| 124 | 98 |
| 119 | 125 |
| 143 | 139 |
| 92 | 142 |
| 135 | 113 |
| 114 | 110 |
| 178 | 128 |
| 158 | 119 |
| 125 | 101 |
| 103 | 128 |
| 110 | |
| 125 | |
| 103 | |
| 104 | |
| 124 | |
| 108 |

Glossary 6E
- extrapolation
- using the model to predict for values of the explanatory variable far outside the range in our data.
- residual standard error
- 𝒔𝒆, is a measure of the variability in the residuals.
