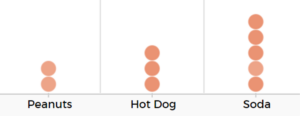

| Outcome | Probability |
| Peanut | |
| Hot Dog | |
| Soda |
| Peanut – Peanut | Hot Dog – Peanut | Soda – Peanut |
| Peanut – Hot Dog | Hot Dog – Hot Dog | Soda – Hot Dog |
| Peanut – Soda | Hot Dog – Soda | Soda – Soda |
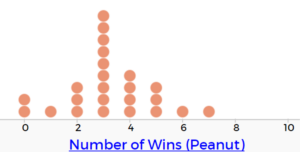
| Number of Wins (Peanut) | Probability |
| Number of Purples | Probability |
| 0 | |
| 1 | |
| 2 | |
| 3 | |
| 4 | |
| 5 |
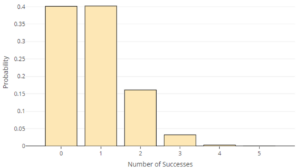
| = Number of Purples | Probability |
| 0 | 0.4019 |
| 1 | 0.4019 |
| 2 | 0.1608 |
| 3 | 0.0322 |
| 4 | 0.0032 |
| 5 | 0.0001 |
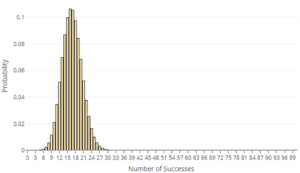
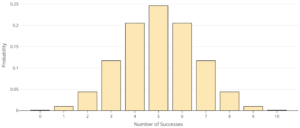
| = Number of heads | Probability |
| 0 | 0.0010 |
| 1 | 0.0098 |
| 2 | 0.0439 |
| 3 | 0.1172 |
| 4 | 0.2051 |
| 5 | 0.2461 |
| 6 | 0.2051 |
| 7 | 0.1172 |
| 8 | 0.0439 |
| 9 | 0.0098 |
| 10 | 0.0010 |
| Outcome | Probability |
| Red | |
| Yellow | |
| Blue |
| Outcome | Probability |
| Outcome | Probability |
| Number of Heads | Probability |
| 0 | 0.25 |
| 1 | |
| 2 |
| Skill or Concept: I can . . . | Questions to check your understanding | Rating from 1 to 5 |
| Construct a probability model to describe simple chance experiments. | 1, 4 | |
| Calculate the probability of a particular event using probabilities given in a table. | 2, 3 | |
| Begin to think critically about the number of “successes” that would occur if a chance experiment were repeated multiple times. | 5–7 |
Glossary
- discrete
- taking a fixed set of possible numerical values where it is not possible to get any value in between.
- probability distribution
- a distribution that includes all possible values of a random variable and the probabilities associated with those values.
- continuous
- including an infinite number of possible values.
- probability model
- a model that includes all possible outcomes of a chance experiment and the probabilities associated with those outcomes.
