10A

A number line showing numbers from 21 to 49 in increments of two. There is a red dot at 30 with arrows extending either direction to 25 and 35, respectively. A number line showing numbers from 41 to 67 in increments of two. A number line showing numbers from 61 to 87 in increments of two. A number line showing numbers from 15 to 16.6 in increments of 0.1. A number line showing numbers from .25 to 0.53 in increments of 0.02. A woman working on a laptop in a dark room. There is a baby in a stroller next to her. A number line showing numbers from 0 to 0.28 in increments of 0.02. A number line showing numbers from 0.65 to 0.79 in increments of 0.01. There is a red dot at 0.72 with arrows extending either direction to 0.7 and 0.74, respectively. Two tables, the first labeled “Descriptive Statistics.” It has a column for “Sample Size,” another for “Successes,” and a third for “Sample Proportion." Under Sample Size, it reads 1,361. Under Successes, it reads 637. Under Sample Proportion, it reads 0.4680. The second table is titled “Estimate of Population Proportion.” It has a column for “Point Estimate,” another for “Standard Error,” another for “z-score,” and one more for “Margin of Error.” Under Point Estimate, it reads 0.4680. Under Standard Error, it reads 0.0135. Under z-score, it reads 1.9600. Under Margin or Error, it reads plus or minus 0.0265. A visualization of a confidence interval. There is a horizontal line with arrows at either end. In the middle, there is a dot labeled “point estimate.” One either side of it, there is a portion of the line labeled “margin of error (E).” The combination of both margins of error is labeled “Confidence interval: has width 2E.” A bell curve with a peak at 0. There are vertical dotted lines at -2 and 2. The region under the curve within the dotted lines is shaded a darker blue and labeled 95.45%. The regions outside the dotted lines are each labeled “2.28%.” An online graphing tool. At the top, “The Normal Distribution” is selected and “Explore,” “Find Probability,” and “Find Percentile/Quartile” are not. On the left side, there is a selection menu. Under “Mean mu,” 0 has been selected from the dropdown. Under “Standard Deviation sigma,” 1 has been selected from the dropdown. Under “Type of Percentile,” “two-tailed” has been selected from the dropdown. Under “Central probability (in %),” 95 has been selected from the dropdown menu. There is a button to download the graph beneath it. To the right is a curve. It is labeled “Normal Distribution with mu = 0 and sigma = 1.” Beneath it, it reads “P(-1.96 < X < 1.96) = 95%.” The bell curve has a peak centered on 0. There are two vertical dotted lines at -1.96 and 1.96, respectively. The region under the curve between the two vertical lines is shaded a darker blue and labeled 95%. There is also a table underneath labeled “z-Score (Two Tailed)” with columns mu, sigma, Centrol Percent, and Percentile. Under mu, the value is 0, under sigma the value is 1, under central Percent, the value is 95%, and under Percentiles, the value is plus or minus 1.96. A number line showing numbers from 0 to 1 in increments of 0.1. There is a red dot labeled “p” at approximately 0.27 with bounds extending from approximately 0.21 to 0.32. A number line showing numbers from 0 to 1 in increments of 0.1. There is a red dot labeled “p” at approximately 0.22 with bounds extending from approximately 0.17 to 0.28. A number line showing numbers from 0 to 1 in increments of 0.1. There is a red dot labeled “p” at approximately 0.36 with bounds extending from approximately 0.31 to 0.43. A number line showing numbers from 0 to 1 in increments of 0.1. There is a red dot labeled “p” at approximately 0.22 with bounds extending from approximately 0.15 to 0.29. A number line showing numbers from 0 to 1 in increments of 0.1. There is a red dot labeled “p” at approximately 0.6 with bounds extending from approximately 0.5 to 0.7

Confidence level, C  
90%
95% 1.96
99%
Skill or Concept: I can . . . Questions to check your understanding Rating
from 1 to 5
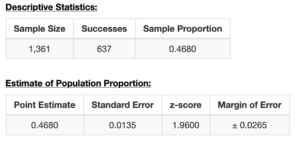
Calculate a point estimate for proportions. 1–3
Understand the connection between sampling distributions, the CLT, and confidence intervals. 4–7
Calculate the standard error of a sample proportion. 6
Determine the z critical value for a given confidence level. 7
Calculate the margin of error for a confidence interval, given the critical value and the standard error. 8
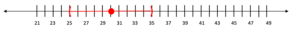
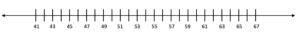
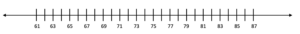
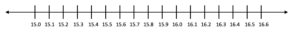
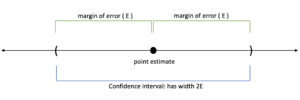
Construct a confidence interval and label it on a number line. 9, 10

Glossary

point estimate
a single value based on representative sample data that is a plausible estimate of the population parameter.
standard error
the estimated standard deviation of sample proportions.
confidence interval for a population proportion
a reasonable range of values where we expect the population proportion to fall within, with a chosen degree of confidence.
margin of error(E)
the width of the confidence interval
confidence level, 𝑪
how much confidence we have in the method used to construct the interval.
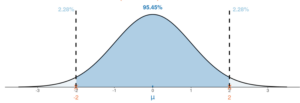
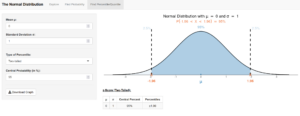
z critical value (𝒛∗)
the point on the standard normal distribution such that the proportion of area under the curve between −𝑧∗and +𝑧∗is 𝐶, the confidence level.