| Null Hypothesis Forms | Alternative Hypothesis Possible Forms | |
| Proportions | ||
| Means |

| Results | |
| Taste Test A | 30 people participate. 17 prefer bottled water. |
| Taste Test B | 30 people participate. 21 prefer bottled water. |
| Results | |
| Taste Test C | 50 people participate. 22 prefer bottled water. |
| Taste Test D | 100 people participate, 44 prefer bottled water. |
| Results | |
| Taste Test B | 30 people participate. 21 prefer bottled water. |
| Taste Test D | 100 people participate. 44 prefer bottled water. |
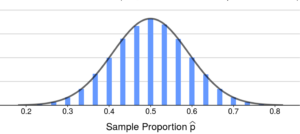
| Sample size = 30
Standard error of = 0.091 |
 |
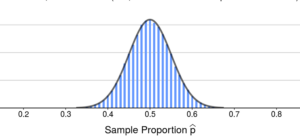
| Sample size = 100
Standard error of = 0.050 |
 |
| Study | Results | Test Statistic | |
| Taste Test B | 30 people participate. 21 prefer bottled water. |
||
| Taste Test D | 100 people participate. 44 prefer bottled water. |
| Skill or Concept: I can . . . | Questions to check your understanding | Rating from 1 to 5 |
| Calculate and interpret standardized scores. | 1–3 | |
| Use a normal distribution to describe the sampling variability of a sample proportion. | 4–6 | |
| Identify sample size as a factor that affects precision in sampling. | 7 | |
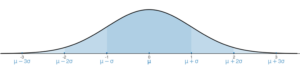
| Use the Empirical Rule to identify unusual values in a normal distribution. | 8, 9 |

Glossary 11A
- conditional
- assuming a certain condition has to be true.
- null hypothesis
- a baseline assumption about a population parameter of interest; what we assume to be true to begin with.
- alternative hypothesis
- what we consider to be plausible if the null hypothesis is false.
Glossary 11B
- test statistic
- a measure of the distance between the sample statistic and the null hypothesis value in terms of the standard error of the statistic.
