| Skill or Concept: I can . . . | Questions to check your understanding | Rating from 1 to 5 |
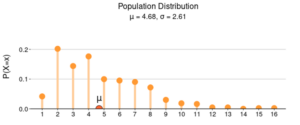
| Use the DCMP Normal Distribution tool to calculate normal probabilities. | 1, 5 | |
| Simulate random samples from a population using the DCMP Sampling Distribution of the Sample Mean (Continuous Population) tool. | 2, 3 | |
| Find the mean and standard deviation of the sampling distribution of the sample mean. | 4 | |
| Use the mean and standard deviation of the sampling distribution of the sample mean to calculate and interpret a z-score for a sample mean. | 6 |

| Sample 2 | Sample 3 | Sample 4 | Sample 5 |
| Skill or Concept: I can . . . | Questions to check your understanding | Rating from 1 to 5 |
| Calculate and interpret a standardized sample mean. | 2, Parts A and B
5 |
|
| Calculate and interpret the standard deviation of a sample mean. | 2, Part C
3, 4 |
|
| Calculate probabilities involving standardized statistics. | 6 |

| Skill or Concept: I can . . . | Questions to check your understanding | Rating from 1 to 5 |
| Identify the population of interest in a research study. | 1, Part A
2, Part A |
|
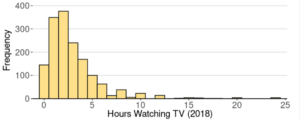
| Use information about a sample to assess whether it is reasonable to think a population is approximately normal in a given context. | 1, Parts C and D
2, Parts C and D |
|
| Calculate and interpret the standard error of the sample mean. | 1, Parts E through G
2, Parts E through G |


Glossary 12A
- z-score
- a measure of a value’s distance from the mean in units of standard deviation, also called standardized score.
- sampling distribution
- the probability distribution of a sample statistic, such as a sample mean or sample proportion, as it varies from sample to sample.
- Central Limit Theorem
- as the sample size gets larger, the distribution of the sample mean will become closer to a normal distribution.
Glossary 12B
- sampling variability
- the tendency of samples to have different statistics (means, proportions) than the population as a whole due to randomness.
- sampling distribution
- the distribution of a sample statistic, such as a sample mean or sample proportion, as it varies from sample to sample.
- standard error
- an estimate of the standard deviation of a statistic.
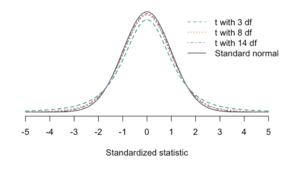
- standard normal distribution.
- a normal distribution with a mean of 0 and a standard deviation of 1.
- t-score
- no description
Glossary 12C
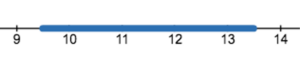
- one-sample t interval
- no description
