| Arts and Humanities | STEM | Education | Business |
| 16 | 18 | 14 | 16 |
| 18 | 20 | 18 | 20 |
| 17.5 | 18.5 | 16 | 15.5 |
| 19 | 22 | 15.5 | 14 |
| 15 | 18 | 16.5 | 12 |
| 17.5 | 20.5 | 17 | 12 |
| 15.5 | 16.5 | 13 | 15 |
| 19.5 | 14 | 19 | 16.5 |
| 21 | 17 | 15 | 17.5 |
| 14 | 19 | 16 | 17 |
| 18 | 23 | 20 | 15 |
| 16.5 | 16 | 12 | 18 |
| Source | df | Sum of Squares | Mean Square | F-Statistic | P-value |
| Group | 2 | 73.04 | 36.52 | 2.198 | 0.11 |
| Error | 250 | 4154.00 | 16.62 | ||
| Total | 252 | 4227.00 |
| Fertilizer Level | Height of Plant (inches) |
| Low | 23.2, 20.9, 21.5, 25.3 |
| Medium | 24.6, 27.7, 22.5, 30.1 |
| High | 29.2, 30.2, 31.1, 33.6 |
| Source | Degrees of Freedom (df) | Sum of Squares | Mean Square | F-Statistic |
| Group | 1
(The number of groups minus 1) |
SSGroup | ||
| Error | (The total number of data points minus the number of groups) | SSError | ||
| Total | 1
(The total number of data points minus 1) |
SSGroup + SSError |
| Source | Degrees of Freedom (df) |
| Group | |
| Error | |
| Total |
| Source | Degrees of Freedom (df) | Sum of Squares | Mean Square |
| Group | 2 | 55.9134 | |
| Error | 9 | 140.0108 | |
| Total | 11 | 195.9242 |
| Skill or Concept: I can . . . | Questions to check your understanding | Rating from 1 to 5 |
| Make connections between the values presented in an ANOVA table. | 1–3 | |
| Describe the shape of the F Distribution. | 4 | |
| Describe how the P-value is represented on the F Distribution. | 5 | |
| Describe how the F-statistic is used in hypothesis testing for a one-way ANOVA. | 6 | |
| Use the P-value to make a conclusion about an ANOVA. | 7, 8 |

ANOVA Table:
| Source | df | Sum of Squares | Mean Square | F Statistic | P-value |
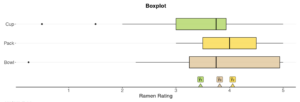
| Group | 3 | 0.7708 | 0.2569 | 0.2736 | 0.8444 |
| Error | 249 | 233.8 | 0.939 | ||
| Total | 252 | 234.5708 |
ANOVA Table:
| Source | df | Sum of Squares | Mean Square | F Statistic | P-value |
| Group | 2 | 5.466 | 2.734 | 3.2 | 0.0456 |
| Error | 87 | 74.34 | 0.8545 | ||
| Total | 89 | 79.808 |
- error sum of squares (SSError)
- the total variation within the groups of interest.
- group sum of squares (SSGroup)
- the total variation between the groups of interest.
- mean square
- the sum of square values divided by the degrees of freedom associated with the respective source (i.e., Group or Error).
