| $3.33 | $2.48 | $2.35 | $2.59 |
| $2.46 | $2.97 | $2.59 | $2.60 |
| $2.96 | $2.57 | $3.21 | $2.55 |
| $2.87 | $2.49 | $3.56 | |
| $2.64 | $2.42 | $2.59 |
| Skill or Concept: I can . . . | Questions to check your understanding | Rating from 1 to 5 |
| Identify observational units and types of variables. | 1–3 | |
| Describe how to simulate a random process using coins. | 4 and 5
6, Parts A and B |
|
| Determine whether data provide evidence against a null hypothesis based on a P-value. | 6, Parts C and D |


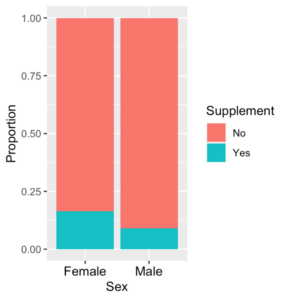
| Take food supplement? | Male | Female | Total |
| Yes | 52 | 132 | 184 |
| No | 524 | 672 | 1,196 |
| Total | 576 | 804 | 1,380 |
| Treated with calcifediol | Untreated with calcifediol | Total | |
| Admitted to ICU | |||
| Not admitted to ICU | |||
| Total |
| Treated with calcifediol | Untreated with calcifediol | Total | |
| Admitted to ICU | |||
| Not admitted to ICU | |||
| Total |
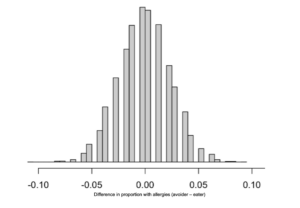
| Peanut avoiders | Peanut eaters | Total | |
| Allergic | |||
| Not allergic | |||
| Total |
| Skill or Concept: I can . . . | Questions to check your understanding | Rating from 1 to 5 |
| Identify observational units and types of variables. | 1 and 2 | |
| Describe how to simulate the random assignment of treatments to experimental groups. | 5, Part A | |
| Determine whether data provide evidence against a null hypothesis based on a simulated null distribution of sample statistics. | 3 and 4
5, Part B 6 |
| Tip percentage
Candy |
Tip percentage
No candy |
| 15.12 | 15.79 |
| 13.58 | 12.85 |
| 16.25 | 13.88 |
| 15.29 | 13.21 |
| 15.58 | 13.07 |
| 15.58 | 15 |
| 13.04 | 13.61 |
| 17.07 | 13.64 |
| 14.29 | 12.38 |
| 18.38 | 14.33 |
| 15.16 | 14.99 |
| 20.46 | 15.03 |
| 21.99 | 13.2 |
| 15.61 | 15.45 |
| 15.01 | 14.72 |
| 19.18 | 16.64 |
| 15.84 | 14.12 |
| 18.49 | 14.23 |
| 23.81 | 14.61 |
| 16.47 | 14.51 |
| 15.84 | 13.42 |
| 19.01 | 13.79 |
| 16.6 | 17.52 |
| 17.19 | 14.42 |
| 19.82 | 14.2 |
| 16.69 | 9.89 |
| 17.87 | 16.79 |
| 15.17 | 16.57 |
| 17.48 | 16.03 |
| 16.02 | 17.36 |
| 15.35 | 13.7 |
| 14.85 | 14.78 |
| 20.82 | 14.99 |
| 16.1 | 17.27 |
| 19.17 | 15.16 |
| 29.21 | 18.09 |
| 18.21 | 16.46 |
| 20.72 | 17.88 |
| 19.38 | 16.6 |
| 19.86 | 15.7 |
| 17.67 | 11.66 |
| 20.46 | 13.78 |
| 22.8 | 19.22 |
| 18.1 | 16.47 |
| 22.77 | 17.52 |
| 17.32 | 18.15 |
Glossary 18D
- randomization test
- simulating many randomizations under the null hypothesis and calculating the proportion of randomizations that produce results like the hypothesis.
