learning GOALS
At the end of this page, you should feel comfortable performing these skills:
- Identify the population for a given study.
- Identify the parameter of interest for a given study.
- Determine whether a sampling method is biased and explain why.
In the upcoming activity, you will need to identify a population and a parameter of interest. You will also need to determine if a sampling method is biased or unbiased.
Each day, we encounter news headlines such as “Nearly Half of U.S. Parents Want More Noncollege Paths”[1] or statements like “Roughly seven-in-ten Americans say they ever use any kind of social media site.”[2] Where are these statistics coming from? Researchers could not have taken a census of all U.S. parents or all Americans to arrive at these conclusions. Instead, these statistics came from a sample of individuals from these groups.
Sampling
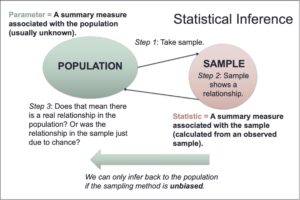
One primary use of statistics is to make inferences about a population based on data collected on a sample from that population. The population is the group of individuals or entities that our research question pertains to (e.g., all Americans), and a parameter is a numerical summary measure that summarizes that population (e.g., the proportion who use social media). A sample is a group of individuals or entities on which we collect data, and a statistic is a numerical summary measure of a sample.
This process of statistical inference is shown in the following figure.
Video Placement
[Perspective: a 3-instructor video that shows how to think about the above terms broadly related (i.e., not in detail — we’ll see methods listed in 2B — but just whether or not the method produces a representative sample). This shouldn’t be an entire lecture but just a sentence or two to help students associate parameter with population and sample with statistic and explains what it means that a sampling method is unbiased, (and if unbiased, then representative which permits us to generalize / make inferences.)
Later in this course, we will explore the idea of statistical inference in more detail. For now, we will focus on determining if our sample is representative of the population. A sampling method is unbiased if, on average, it results in a representative sample of the population. A sampling method is biased if it has a tendency to produce samples that are not representative of the population. If the sampling method is biased, we cannot generalize our results to the population and can only make statements about the sample itself.
Sampling from Populations
Let’s try to identify the population and parameter in a description of a study. We’ll also determine whether the sampling method in the study was biased or unbiased. See the video below for a demonstration, then try Questions 1 and 2.
Video Placement
[Worked Example: a 3-instructor worked example in the style of Questions 1 and 2.]
Example
[Optional — This could be a good location to briefly introduce a choose-your-own study example in the style of Questions 1 and 2 — these tasks are challenging for students. An active example would be beneficial in addition to the 3-instructor worked example.]
question 1
1) A television station is interested in predicting whether or not a local referendum to legalize marijuana for adult use will pass. It asks its viewers to phone in and indicate whether they are in favor of or opposed to the referendum. Of the 2,241 viewers who phoned in, 45% were opposed to legalizing marijuana.
Part A: What is the population?
- a) The 2,241 viewers who phoned in
- b) All local voters
- c) Whether the viewer is in favor of or opposed to the referendum
- d) All viewers of the television station
Part B: What is the parameter of interest?
- a) Whether the viewer is in favor of or opposed to the referendum
- b) The value 45% measured on the sample
- c) The proportion of all local voters who opposed legalizing marijuana
- d) The number of viewers who opposed legalizing marijuana
Part C: Is the sampling method biased or unbiased? Explain.
question 2
2) Gallup has been tracking presidential job approval in the United States for over 80 years.[3] In their presidential approval survey, Gallup asks “Do you approve or disapprove of the way [president’s name] is handling his job as president?” Recently, a random sample of 1,395 U.S. adults was selected by random-digit dialing of both landlines and cell phones, but only 256 of those selected chose to respond to the survey. Of those who responded, 48% said they approved of the way the president is handling his job.
Part A: What is the population?
- a) The president of the United States
- b) The 1,395 U.S. adults selected for the survey
- c) The 256 U.S. adults who responded to the survey
- d) All U.S. adults
Part B: What is the parameter of interest?
- a) The proportion of U.S. adults who responded to the survey
- b) The proportion of U.S. adults who approved of the way the president is handling his job
- c) Whether a U.S. adult approves of the way the president is handling his job
- d) The proportion of those who responded to the survey that approve of the way the president is handling his job
Part C: Is the sampling method biased or unbiased? Select all that apply.
- a) Unbiased, since a random sample was selected
- b) Biased, since the sample size is too small
- c) Biased, since those who chose to respond may be systematically different than those who chose not to respond
- d) Unbiased, since random-digit dialing was used
- e) Biased, since not all U.S. adults may have a phone
Looking Ahead
Supreme Court Justice Sonia Sotomayor gave a speech at the University of California at Berkeley on October 26, 2001.Berkley Law. (2009, May 26). Supreme Court Nominee Sonia Sotomayor’s speech at Berkley Law in 2001. https://www.law.berkeley.edu/article/supreme-court-nominee-sonia-sotomayors-speech-at- berkeley-law-in-2001/[/footnote] This speech was originally published in the Berkeley La Raza Law Journal in 2002. What follows is an excerpt from that speech (continued on the following page).
For me, a very special part of my being Latina is the mucho platos de arroz, gandoles y pernir – rice, beans and pork – that I have eaten at countless family holidays and special events. My Latina identity also includes, because of my particularly adventurous taste buds, morcilla,—pig intestines—patitas de cerdo con garbanzo—pigs' feet with beans—and la lengua y orejas de cuchifrito—pigs' tongue and ears. I bet the Mexican-Americans in this room are thinking that Puerto Ricans have unusual food tastes. Some of us, like me, do. Part of my Latina identity is the sound of merengue at all our family parties and the heart wrenching Spanish love songs that we enjoy. It is the memory of Saturday afternoon at the movies with my aunt and cousins watching Cantinflas, who is not Puerto Rican, but who was an icon Spanish comedian on par with Abbot and Costello of my generation. My Latina soul was nourished as I visited and played at my grandmother's house with my cousins and extended family. They were my friends as I grew up. Being a Latina child was watching the adults playing dominos on Saturday night and us kids playing loteria, bingo, with my grandmother calling out the numbers which we marked on our cards with chick peas.
Now, does any one of these things make me a Latina? Obviously not because each of our Caribbean and Latin American communities has their own unique food and different traditions at the holidays. I only learned about tacos in college from my Mexican-American roommate. Being a Latina in America also does not mean speaking Spanish. I happen to speak it fairly well. But my brother, only three years younger, like too many of us educated here, barely speaks it. Most of us born and bred here, speak it very poorly.
If I had pursued my career in my undergraduate history major, I would likely provide you with a very academic description of what being a Latino or Latina means. For example, I could define Latinos as those peoples and cultures populated or colonized by Spain who maintained or adopted Spanish or Spanish Creole as their language of communication. You can tell that I have been very well educated. That antiseptic description however, does not really explain the appeal of morcilla—pig intestines—to an American born child. It does not provide an adequate explanation of why individuals like us, many of whom are born in this completely different American culture, still identify so strongly with those communities in which our parents were born and raised.
question 3
3) Try to select a representative sample of 10 words from the excerpt by circling them with your pen or pencil. Then fill in the table below with your selected words. Bring this table with you to class.
| Observation | Word |
| 1 | |
| 2 | |
| 3 | |
| 4 | |
| 5 | |
| 6 | |
| 7 | |
| 8 | |
| 9 | |
| 10 |
Summary
In this What to Know page, you defined some important statistical terms. You learned that the parameter of interest for a population can be represented by a sample statistic for samples that have characteristics representative of the population characteristics. You saw that when this is true, you are able to use information about the sample to generalize to or infer about the population. You also learned how to identify biased sampling methods and what makes a sampling method unbiased. Let’s summarize these new skills.
- In Questions 1 – 2 Part A, you identified the population for a given study.
- In Questions 1 – 2 Part B, you identified the parameter of interest for a given study.
- In Questions 1 - 2 Part C, you determined whether a sampling method was biased and why.
- In Question 3, you prepared for the upcoming activity. Don't forget to have your answer ready when you begin the activity!
If you feel comfortable with these ideas, it’s time to move on to Forming Connections.
- 1 Hrynowski, Z. (2021, April 7). Nearly half of U.S. parents want more noncollege paths. Gallup.https://news.gallup.com/poll/344201/nearly-half-parents-noncollege-paths.aspx ↵
- Auxier, B. & Anderson, M. (2021, April 7). Social media use in 2021. Pew Research Center. https://www.pewresearch.org/internet/2021/04/07/social-media-use-in-2021/ ↵
- Newport, F. (2001, July 25). Examining presidential job approval. Gallup. https://news.gallup.com/poll/4723/examining-presidential-job-approval.aspx ↵
