Objectives for this activity
During this activity, you will:
- Demonstrate how to use a rating scale to critique a complex graphical display.
Complex Graphical Displays in the Media

You’ve learned quite a lot about reading and interpreting graphical displays in this module. You’ve seen examples of good displays and learned the type of design errors and inconsistencies that can cause a graph or display to be misleading. In this activity, you’ll use your knowledge of complex graphical displays and apply principles of design to critique a set of graphical displays and you’ll see that complex graphical displays encountered in the media are not all accurately and correctly created and/or interpreted.
Let’s begin by recalling the criteria for effective visualization and some of the ways you can tell a graph may have a misleading component.
Recall
Core skill:
Core skill:
Think about Question 1 individually, then share your answer with a partner.
question 1
Have you experienced situations where the media presented graphical displays that seemed confusing or were misleading?
If so, how did you determine the graphical displays were flawed?
Guidance
[Intro: Were you able to recall a particular misleading graph or one that seemed confusing? A graph’s author may not intend to confuse, but if vital information is missing it could render the graph useless at best and misleading at worst. Some disreputable organizations online even attempt to deliberately mislead by omitting information or providing inconsistent scales. Being able to critique a display for effective visualization or misleading components is a useful skill to have and one that increases in power through repeated use.]
To gain experience critiquing graphs, you’ll participate in a gallery walk. Apply everything you’ve learned so far about design and components to complete the activity.
Before beginning the gallery walk activity, let’s critique a practice graphical display.
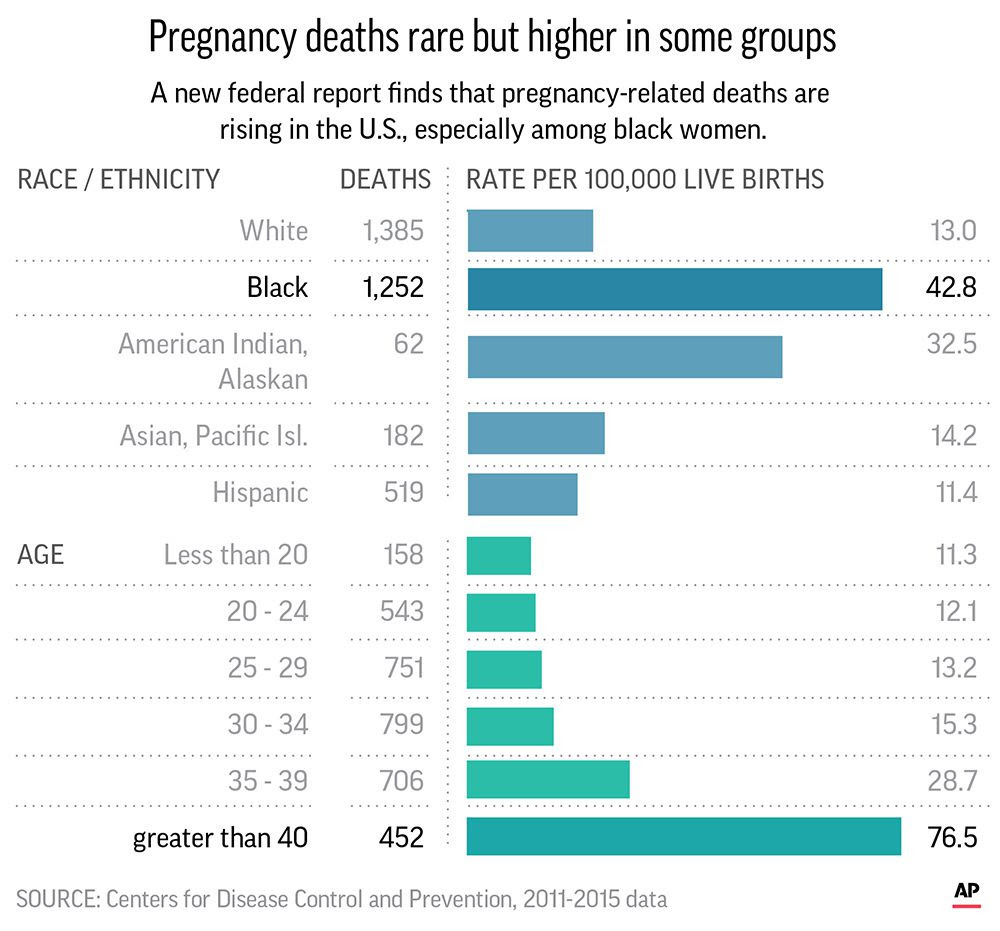
example
Critique the graphical display by answering the questions below.
[Note: This is provided by DC in the Instructor Guide page. Please cite this properly and add alt text. I am unsure of the best way to do these according to Lumen style guides]
Evaluate this graphical display by answering these questions.
- Is this graph clear in communicating patterns/trends?
- What are we supposed to be comparing in this graph?
- What do the different colors represent?
- What is the scale for the bar chart?
Now you try critiquing the displays in the gallery walk activity. Keep an open mind, reflect on the graphs using the criteria and rating scale and consider the types of questions we asked in the practice example able.
Gallery Walk Activity
To complete this activity. your instructor will provide four graphical displays for your to critique. You will consider, individually, each display, making individual notes and comments about it. Do not discuss them with other students before making your comments. Once you record your ideas, please respond to comments others have made. You’ll need the best practices criteria and a rating scale to evaluate the graphical displays. Your teacher may provide you a hard copy. One is linked below for you to view digitally or print out as needed.
[link to the DC Instructor Page (page 7), Best Practices Criteria, in pdf form]
Your instructor will provide digital or printed copies of the four graphical displays. Follow the instructions below to critique each of the graphs.
At each station:
- Rate the graphical display using the ranking criteria and rating scale provided by your instructor.
- Consider the graphical display and complete the following sentence: “The story I am getting from this graphical display is _______________.”
- Make comments in the space provided in the classroom for your classmates to see and/or respond to comments posted by your classmates.
Guidance
[Summary: Now that you’ve had a chance to observe the graphical displays on your own and respond to others, what did you conclude? That is, based on your rating scales, which graphical displays could be labeled as misleading? Why? What did you notice about the rating scales for Graphical Displays 1 and 4? How did they compare to the Graphical Displays for 2 and 3? ]
Individual Reflection
Question 2
Do any of the graphical displays seem misleading? If so, what are some possible reasons the graphical display(s) may be misleading?
Guidance
[Wrap-up: Hopefully you’ve discovered in this experience the importance of having a critical perspective when interpreting complex visual displays. That is, they should be questioned by using a standard criteria. Ask questions about the visualization techniques utilized. Remind yourself of some of the reasons a graphical display can be misleading. Arm yourself with the ability to critique displays presented in the media. ]
