Objectives for this activity
During this activity you will:
- Identify the estimated slope and estimated y-intercept given the equation of the line of best fit.
- Interpret the estimated slope and interpret the estimated y-intercept in the specific context of a problem.
- Assess the reasonableness of estimations.
Hopefully, you are beginning to feel proficient using the data analysis tool to generate equations for lines of best fit to identify the estimated slope and y-intercept. In this activity, you’ll focus on the interpretation of these measures in the context of the given scenario. You’ll also assess the reasonableness (or unreasonableness) of using a linear model to extrapolate from the data. Along the way, you’ll develop a deeper understanding that the equation of the the line of best fit is based on sample data and will change from dataset to dataset.
Guidance
[Intro: As you work through this activity, look for these key concepts:
- It is important to look for trends in quantitative data early and via both visual and technical methods.
- It is crucial for you to be able to identify the explanatory and response variables on your own. Try defending your answers individually to Question 1 Part B.
- A foundational fact about lines of best fit is that each dataset will generate its own different linear equation. Each equation provides estimates of the slope and y-intercept unique to that dataset. ]
Let’s get started with an interesting set of data that relates cricket chirps with the outside temperature.
Learning from a Cricket and a Scientist Who Died a Long Time Ago
| Chirps per second | Temperature (in [latex]^\circ \text{F}[/latex] ) |
| 20 | 88.6 |
| 16 | 71.6 |
| 19.8 | 93.3 |
| 18.4 | 84.3 |
| 17.1 | 80.6 |
| 15.5 | 75.2 |
| 14.7 | 69.7 |
| 17.1 | 82 |
| 15.4 | 69.4 |
| 16.2 | 83.3 |
| 15 | 79.6 |
| 17.2 | 82.6 |
| 16 | 80.6 |
| 17 | 83.5 |
| 14.4 | 76.3 |
question 1
In a previous assignment, you were introduced to a famous study conducted in the 1940s on the relationship between the number of chirps made by a striped ground cricket (measured in number of wing vibrations per second) and the surrounding ground temperature (measured in degrees Fahrenheit).
Dr. Pierce wanted to see if it seemed reasonable to predict the temperature based on the number of chirps.
Part A: What did you think when you first read about this study? Can you think of situations where we might learn from the behavior of animals using quantitative variables?
Part B: Identify the explanatory and response variables in Dr. Pierce’s experiment.
Work in small groups or pairs to answer Questions 2 and 3. Don’t just answer Parts A through C in Question 2, but support your claims using the outputs from the data analysis tool.
Estimated Slope and Y-Intercept in Context
question 2
The following is the output from the DCMP Linear Regression tool for the cricket data:
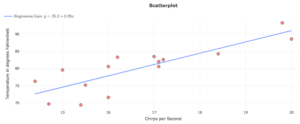
Linear Regression Equation:
| Parameter | Estimate |
| Intercept | 25.23 |
| Slope (Chirps per Second) | 3.291 |
Model Summary:
| Statistic | Value |
| Correlation Coefficient r | 0.835 |
| Coefficient of Determination r^2 | 69.7% |
| Residual Standard Deviation | 3.829 |
Part A: Does it seem reasonable to use a linear model to describe the relationship between Chirps per second and Temperature? Clearly answer “yes” or “no.” Cite at least two pieces of evidence to support your claim.
Part B: Is the association positive or negative? Strong or weak? Cite evidence to support your claim.
Part C: Describe what the variables in the line of best fit represent.
Part D: Interpret the slope of the line of best fit in context.
Part E: The line of best fit was generated by the 15 data points produced by a cricket that lived in the 1940s. If you repeated the same study today, do you think the results would be exactly the same, similar, or very different? Explain.
Part F: Is it reasonable to interpret the estimated y-intercept in this scenario? Support your answer.
question 3
Which of the following statements are correct? Choose all that apply.
This study of cricket chirps per second and temperature demonstrates that you can use linear modeling in the following way:
- a) Number of chirps per second can be used to predict the temperature.
- b) Number of chirps per second can be used to calculate the estimated temperature.
- c) Number of chirps per second can be used to determine the actual temperature.
- d) An increase in the number of chirps means it is likely that there will be an increase in the temperature.
- e) An increase in the number of chirps per second will cause an increase in the temperature.
- f) All of the above
- g) None of the above
Guidance
[Summary: In Question 2, Part F, you were asked to extrapolate. That is, you were asked to discuss a value of the explanatory variable that did not exist in the observed data. There are dangers inherent in the act of extrapolation from the known variable values in a dataset. Let’s discuss this briefly.
- Extrapolation is the prediction of a response value using an explanatory variable value that is outside the range of the original data.
- We must always be cautious regarding the reasonableness of extrapolation. If the known input does not include or even come close to zero, we may obtain a fully unreasonable interpretation of the y-intercept in the given dataset. ]
Continue to practice writing interpretations and answering questions using statistical terminology and support from the data and analysis tool as you answer Question 4.
question 4
Recall the Beer Alcohol example from the preview assignment. The model uses alcohol % (explanatory variable) to predict the calories in a bottle of beer (response variable). The equation for the line of best fit is:
[latex]\hat{y} =8.27+28.2x[/latex]
The equation can be rewritten using context and proper notation as follows:
(Estimated calories = 8.27 + 28.2(alcohol%)
Part A: Visualize the data on 227 bottles of beer by going to the DCMP Linear Regression tool at https://dcmathpathways.shinyapps.io/LinearRegression/. Write a sentence describing the trend in the data.
Part B: Does the trend you identified in Part A make sense?
Part C: Is it reasonable to interpret the estimated y-intercept in this scenario? Specifically, does it make sense that a bottle of beer with zero alcohol in it could have a calorie count of 8.27 calories?
Part D: Interpret the estimated y-intercept, [latex]a=8.27[/latex].
Guidance
[Wrap-Up: Take a look back at the objectives for this activity and identify where they were located in the questions your answered in this activity. ]
