goals for this section
After completing this section, you should feel comfortable performing these skills.
- Define the standardized value, or z-score.
- Use technology to convert values into standardized scores.
- Use a dotplot and histogram to identify the number of standard deviations from the mean of certain observations.
- Calculate a value’s standardized score by hand to determine its location relative to the mean.
- Define the Empirical Rule.
Click on a skill above to jump to its location in this section.
In the next activity, you will need to be able to convert values into standardized scores and use a value’s standardized score to determine whether the value is above, below, or equal to the mean. You will also need to be able to explain the Empirical Rule. In this section, we’ll use a dataset to explore how to perform necessary calculations by hand and using technology.
Standardized Values
Definition of Standardized Value (Z-Score)
A standardized value, or z-score, is the number of standard deviations an observation is away from the mean.
To learn how to calculate standardized values, we will analyze runtimes (in minutes) of G-rated movies. Within this context, the standardized value, or z-score, is the number of standard deviations a particular movie runtime is from the mean.
It is important to note that this distance is not measured in minutes; rather it is measured in standard deviations. Thus, a z-score of -2.3 is an observation that is 2.3 standard deviations below the mean, and a z-score of 2.3 is an observation that is 2.3 standard deviations above the mean. It is important to note that z-scores do not have units associated with them.
standard deviation as a unit of distance
[Perspective video — a 3-instructor video showing how to think about standard deviation as a unit of distance — i.e., illustrating values so many standard deviations above and below the mean of a bell-shaped, unimodal, symmetric distribution. Show how adding or subtracting std devs can obtain a new value at that location.]
Interactive example
A particular dataset has a mean of 61 and a standard deviation of 3.7. Calculate the following values.
- A value that is one standard deviation above the mean.
- A value that is one standard deviation below the mean.
- A value that is one-and-a-half standard deviations below the mean.
- A value that is two standard deviations above the mean.
Use Technology to Convert Values into Standardized Scores
The value of an observation is standardized using the formula [latex]z=\dfrac{x-\mu}{\sigma}[/latex], where [latex]x[/latex] represents the value of the observation, [latex]\mu[/latex] represents the population mean, [latex]\sigma[/latex] represents the population standard deviation, and [latex]z[/latex] represents the standardized value, or z-score.
We’ll use technology to calculate the standard deviation of a dataset in order to convert values to standardized scores.
Go to the Describing and Exploring Quantitative Variables tool at https://dcmathpathways.shinyapps.io/EDA_quantitative/.
Step 1) Select the Single Group tab.
Step 2) Locate the dropdown under Enter Data and select From Textbook.
Step 3) Locate the drop-down menu under Dataset and select Movie Runtime (G Rated 1990-2016).
Step 4) Under Choose Type of Plot, select the options to create a Histogram and a Dotplot of runtime (in minutes).
question 1
Describe the shape of the dataset using the histogram and dotplot you created.
question 2
What is the mean runtime for this dataset?
question 3
What is the standard deviation for this dataset?
Identify the Number of Standard Deviations an Observation is From the Mean
Use the mean and the standard deviation you entered in Questions 2 and 3 to answer the following questions.
question 4
What movie runtime is one standard deviation above the mean? What movie runtime is one standard deviation below the mean? Round to the nearest tenth.
question 5
What movie runtime is two standard deviations above the mean? What movie runtime is two standard deviations below the mean? Round to the nearest tenth.
Calculate a Z-Score to Determine a Value’s Location Relative to the Mean
Now that you have obtained the standard deviation of the dataset Runtimes using technology, you can calculate any observation’s z-score to locate it in the dataset relative to the mean.
calculating z-scores
[Worked example video – a 3-instructor video that works through an example like questions 6 – 9]
Interactive Example
Recall, to calculate a z-score given an observation, use the formula [latex]z=\dfrac{x-\mu}{\sigma}[/latex], where [latex]x[/latex] represents the value of the observation, [latex]\mu[/latex] represents the population mean, [latex]\sigma[/latex] represents the population standard deviation, and [latex]z[/latex] represents the standardized value, or z-score.
For a dataset with a mean of 132 and standard deviation of 9.8, calculate the z-scores of the following observations, [latex]x[/latex], and indicate if the given value is above or below the mean. Round answers to 2 decimal places.
- [latex]x=112[/latex]
- [latex]x=141[/latex]
- [latex]x=158[/latex]
Use the mean and the standard deviation you calculated in Questions 2 and 3 to answer Questions 6 – 9.
question 6
Calculate the z-score for the movie 101 Dalmatians, which has a length of 103 minutes. How many standard deviations from the mean is this movie runtime? Make sure to indicate if this movie runtime is above or below the mean. Round your answer to 2 decimal places.
question 7
Calculate the z-score for the movie The Rookie, which has a length of 127 minutes. How many standard deviations from the mean is this movie runtime? Make sure to indicate if this movie runtime is above or below the mean. Round your answer to 2 decimal places.
question 8
Calculate the z-score for the movie The Adventures of Elmo in Grouchland, which has a length of 73 minutes. How many standard deviations from the mean is this movie runtime? Make sure to indicate if this movie runtime is above or below the mean. Round your answer to 2 decimal places.
question 9
Calculate the z-score for the movie The Hunchback of Notre Dame, which has a length of 91 minutes. How many standard deviations from the mean is this movie runtime? Make sure to indicate if this movie runtime is above or below the mean. Round your answer to 2 decimal places.
The Empirical Rule
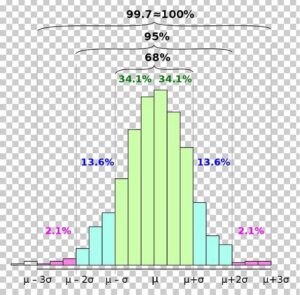
If a distribution is bell shaped, unimodal, and symmetric, then we can estimate how many observations are within a certain number of standard deviations. The Empirical Rule (also known as the 68-95-99.7 rule) is a guideline that predicts the percentage of observations within a certain number of standard deviations.
the empirical rule
[insert a video describing (but not using) the Empirical Rule]–>this video could be good, but she refers back to other lessons and writes on the diagram in a way that could be confusing (calculating half of 68% and not others, uses x bar and s instead of mu and sigma, writes 99.7% on the outside of the bell while the others are clearly written inside). She begins an example at 4:41.
Define the Empirical Rule
The Empirical Rule states that:
- about 68% of observations in a dataset will be within one standard deviation of the mean.
- about 95% of the observations in a dataset will be within two standard deviations of the mean.
- about 99.7% of the observations in a dataset will be within three standard deviations of the mean.
Graphically, the Empirical Rule can be expressed like this:
Fill in the blank for each of Questions 10 – 12
question 10
If a distribution is bell shaped, unimodal, and symmetric, then approximately 68% of the observations are between ____ standard deviation above the mean and ___ standard deviation below the mean.
question 11
If a distribution is bell shaped, unimodal, and symmetric, then approximately 95% of the observations are between ____ standard deviations above the mean and ___ standard deviations below the mean.
question 12
If a distribution is bell shaped, unimodal, and symmetric, then approximately 99.7% of the observations are between ____ standard deviations above the mean and ___ standard deviations below the mean.
Summary
In this section, you’ve seen how to convert observed values into standardized scores (z-scores) and that the value of the z-score gives meaningful information about the location of the observation with respect to the mean of a dataset. You also seen how to explain what the Empirical Rule is. Let’s summarize where these skills showed up in the material.
- In question 1 – 5, you converted values into standardized scores.
- In Questions 6 – 9, you used a value’s standardized score to determine whether the value is above, below, or equal to the mean.
- In Questions 10 – 12, you explained the Empirical Rule.
Being able to calculate z-scores and understanding the Empirical Rule will be necessary for completing the next activity. If you feel comfortable with these skills, it’s time to move on!
