Question 1
1) Which corporations from around the world do you think contribute the most to polluting our environment with plastic waste?
Credit: iStock/piotr_malczyk
In Questions 2–9, you will use a dataset called “plastics.” This dataset is a sample of plastic products collected by community volunteers in countries around the world during a brand audit to see what types of plastics are found in waste and from which companies the plastics found came from.
The dataset can be accessed here:
https://docs.google.com/spreadsheets/d/15RIs8K9MaGVfYQmi15bH87dUIz8X1o60Wcs ukoLlFFo/edit?usp=sharing.
The dataset variables and variable descriptions are provided in the following table.
| Variable | Description |
| country | Country of cleanup |
| year | Year (2019 or 2020) |
| parent_company | Source of plastic |
| empty | Category left empty count |
| hdpe | High-density polyethylene count (plastic milk containers, plastic bags, bottle caps, trash cans, oil cans, plastic lumber, toolboxes, supplement containers) |
| Idpe | Low-density polyethylene count (plastic bags, Ziploc bags, buckets, squeeze bottles, plastic tubes, chopping boards) |
| other_count | Category marked other count |
| pet | Polyester plastic count (polyester fibers, soft drink bottles, food containers [also see plastic bottles]) |
| pp | Polypropylene count (flower pots, bumpers, car interior trim, industrial fibers, carry-out beverage cups, microwavable food containers, DVD cases) |
| ps | Polystyrene count (toys, video cassettes, ashtrays, trunks, beverage/food coolers, beer cups, wine and champagne cups, carry-out food containers, styrofoam) |
| pvc | PVC plastic count (window frames, bottles for chemicals, flooring, plumbing pipes) |
| grand_total | Grand total count (all types of plastic) |
| num_events | Number of counting events |
| volunteers | Number of volunteers |
Question 2
2) Plastic items contain recycling codes that appear within a chasing arrow logo like the one shown here:
What do you think these codes mean?
Question 3
3) Looking at the “plastics” dataset, how many different types of plastic are represented in the dataset? List the different types.
Question 4
4) Use the following dashboard website that has the “plastics” dataset loaded: https://sarahsauve.shinyapps.io/TidyTuesdayBrandAuditDashboard/.
Select a country that interests you from the drop-down menu at the top of the #breakfreefromplastic dashboard.
a) What are the total numbers of plastics recorded in 2019 and 2020 for that country?
b) Are there any companies reported as top polluters in 2019 or 2020 for that country? If so, what is the top company and what is the % of recorded plastics?
In Questions 5–8, you will use a subset of the “plastics” dataset. This subset contains all of the countries from the original data that have counts of plastics from The Coca-Cola Company in 2020. To create the subset, go to the “plastics” dataset and complete the following steps:
- Highlight the top row.
- Select “Data.”
- Select “Filter views.”
- Select “Create new temporary filter view.”
Now, filter the data using parent_company = “The Coca-Cola Company” and year = “2020.” If filtered correctly, the number of observations in the dataset should be [latex]n[/latex] = 50, and the first few observations should look like this:
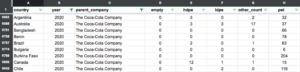
NO ALT TEXT
Question 5
5) We are interested in answering the following research question about the “plastics” dataset:
“For the products reported from The Coca-Cola Company, is the average total plastics count found in various countries in 2020 different from the claimed value of 275 items for The Coca-Cola Company?”
a) Based on the research question, are we interested in testing a proportion or a mean?
Remember that for confidence intervals, if the population standard deviation is not known, the confidence intervals are based on the t Distribution rather than the normal distribution.
b) What distribution do you think would be used in a hypothesis test that would answer this research question?
c) Why should that type of distribution be used?
d) Is this a one-sample or two-sample test?
Recall from In-Class Activity 12.B:
| t Distribution
When taking many, many random samples of size [latex]n[/latex] from a population distribution with mean [latex]\mu[/latex] and standard deviation [latex]\sigma[/latex], the t-statistic [latex]t=\frac{\bar{x}-\mu}{SE(\bar{x})}=\frac{\bar{x}-\mu}{s/\sqrt{n}}[/latex] will follow a t Distribution with [latex]n-1[/latex] degrees of freedom if: 1. the population distribution is normal; or 2. the population distribution is not too skewed and the sample size is large (e.g., [latex]n[/latex] ≥ 30). |
As was the case with previous inference methods, there are a few assumptions/conditions that you should check before using the one-sample t-test.
Conditions for a One-Sample t-Test
- The sample is a random sample from the population of interest or it is reasonable to regard the sample as if it is random. It is reasonable to regard the sample as a random sample if it was selected in a way that should result in a sample that is representative of the population.
- For each population, the distribution of the variable that was measured is approximately normal, or the sample size for the sample from that population is large. Usually, a sample of size 30 or more is considered to be “large.” If a sample size is less than 30, you should look at a plot of the data from that sample (a dotplot, a boxplot, or, if the sample size isn’t really small, a histogram) to make sure that the distribution looks approximately symmetric and that there are no outliers.
Question 6
6) Create a histogram of the grand totals of all plastics found in various countries in 2020 for The Coca-Cola Company using the DCMP Describing and Exploring Quantitative Variables tool at https://dcmathpathways.shinyapps.io/EDA_quantitative/. Describe the shape and spread of the histogram. Note that a random sample of countries was taken each year, and the actual countries included varied from year to year.
Question 7
7) Verify the conditions are met for a one-sample t-test.
a) Are the data a random sample from the population of interest? Is this condition met? Explain.
b) Is the distribution of the variable total plastic counts approximately normal, or is the sample size for the sample from that population large? Is this condition met? Explain.
Question 8
8) Write out the null and alternative hypotheses that would be used to answer the research question stated in Question 5. Remember to use the correct notation.
Question 9
9) What if we are interested in answering the following question using samples from the “plastics” dataset:
“For the products reported from The Coca-Cola Company, is the average total plastics count found in various countries in 2020 less than the average total plastics count from 2019?”
a) Is this a one-sample or two-sample test?
b) Write the null and alternative hypotheses that would be used to answer the research question. Define the parameters of interest using the correct notation, using [latex]\mu_{1}[/latex]to represent the population mean for total plastics for The Coca-Cola Company in 2019 and [latex]\mu_{2}[/latex] to represent the population mean for total plastics for The Coca-Cola Company in 2020.
