Preparing for the next class
In the next in-class activity, you will need to understand chance and how to calculate theoretical probabilities.
A chance experiment involves making observations in situations where there is uncertainty about which of two or more possible outcomes will result.
The sample space of a chance experiment is the collection of all possible outcomes for the experiment.
Question 1
Consider the following chance experiments. List the possible outcomes.
-
- Roll a six-sided die one time.

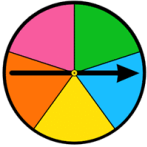
- One spin of the following spinner
- Flip a fair coin two times. Let H be heads and T be tails. Let HH represent the outcome of heads on the 1st time and the 2nd time. Let TT represent the outcome of tails on the 1st time and the 2nd time.
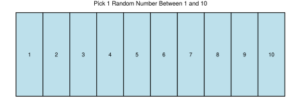
Hint: There are four possible outcomes. - Pick a random number between 1 and 10.
- Roll a six-sided die one time.
For a chance experiment, we are often interested in the likelihood of a particular outcome (or collection of outcomes). An outcome or collection of outcomes for a chance experiment is called an event. The probability of an event is a numeric measure of how likely it is for the event to happen.
The conventional notation “P(event)” indicates “probability of an event.”
Facts about probabilities:
- The probability of a certain event (an event that will happen) is equal to 1. For example, if you roll the die presented in Question 1, Part A, the probability that you roll a number less than a 7 is equal to 1 because it is certain that you will roll a number less than 1.Thus, P(rolling less than a 7) = 1
- The probability of an impossible event is equal to 0. This means that there are no possible outcomes for that event. For example, if you roll the die presented in Question 1, Part A, the probability that you roll a 9 is 0.Thus, P(rolling a 9) = 0.
- Probabilities range from 0 to 1, including 0 and 1.So, for any event A, 0 ≤ [latex]P(A)[/latex] ≤ 1.
- Probabilities can be expressed as decimals, fractions, or percentages.
Question 2
Select the valid probabilities from the list. Choose all that apply.
- 0
- -2
- 1.2
- 0.5
- 0.0001
- 1/3
- 5/3
For a chance experiment in which outcomes of the sample space are equally likely, the probability of an event is the number of outcomes in the event divided by the number of possible outcomes in the sample space.
Question 3
Consider the chance experiments from Question 1. Calculate the probability of the event listed.
-
- Roll a six-sided die one time. What is the probability of the event that you roll a 6?
- Complete one spin on the following spinner. What is the probability of the event that the spinner lands on yellow?
- Flip a fair coin two times. What is the probability of the event that the coin lands on tails on the 1st and 2nd flip?
- Pick a random number between 1 and 10. What is the probability of the event that the number selected is even?
- Roll a six-sided die one time. What is the probability of the event that you roll a 6?
The values calculated in Question 3 are called theoretical probabilities. You did not actually flip a coin or spin a spinner to measure how likely the event was.
Question 4
Let’s focus on the chance experiment where we pick a random number between 1 and 10.
*missing image*
- What is the theoretical probability of the event that the number selected is the number 9? In other words, P(number is a 9) = ?
- If you were to select 10 numbers (with replacement), how many times do you think you would get a 9?
To estimate the probability of an event, you can carry out the chance experiment and look at how often the event occurred. Recall that how often something occurs in a dataset is called the relative frequency. The probability estimated from a chance experiment is called an empirical probability. The theoretical probability of an outcome is the proportion of times the outcome would occur in the long run.
Question 5
Use the DCMP Random Number Generator to carry out the chance experiment defined in Question 4, Part B.
Direct link: https://dcmathpathways.shinyapps.io/RandomNumbers/
Use the following inputs:
- Choose Minimum: 1
- Choose Maximum: 10
- How many numbers would you like to generate? 10
- Sample with Replacement? Yes (because we want to look at the number and put it back so we are always picking from 10 possible numbers)
- Select “Frequency Table”
- Select “Generate”
- Enter the results of your chance experiment. You can find the results under “Current Simulation.”
- How many times did you see the number 9 in your experiment?
- In your chance experiment, what was the probability of selecting a 9? That is, in other words, what is the estimated probability of getting a 9?
- Is the probability that you calculated in Part C a theoretical or empirical probability?
- Did the estimated probability of selecting a 9 in your chance experiment equal the theoretical probability calculated in Question 4, Part A?
Looking ahead
Question 6
Repeat the chance experiment, but select 100 numbers. Again, use the DCMP Random Number Generator to carry out the chance experiment.
Use the following inputs:
- Choose Minimum: 1
- Choose Maximum: 10
- How many numbers would you like to generate? 100
- Sample with Replacement? Yes (because we want to look at the number and put it back so we are always picking from 100 possible numbers)
- Select “Frequency Table”
- Select “Generate”
Record how many times you saw the number 9 in your experiment. You can find this information in frequency table generated by the tool. Please bring this number to class.
