Recall the maternal smoking study presented in Preview Assignment 13.C.
Researchers wanted to study the difference in birth weight of babies born to mothers who smoked during pregnancy (smoke_now = yes) and mothers who did not smoke during pregnancy.
Question 1
1) Discuss the differences that you saw in the visualization between the birth weights of babies born to women who smoked during pregnancy compared to mothers who did not smoke during pregnancy.
Question 2
2) How can we make an inference about the difference when the population refers to all pregnant women?
In the previous in-class activity, you reviewed and applied the steps to perform a one sample t-test (a hypothesis test about a population mean). We can apply the same steps to analyze and test a hypothesis about the difference in means for two independent populations. A hypothesis test for comparing two population means is often referred to as a two-sample t-test.
In the preview assignment, you verified that the assumptions for a two-sample t-test were met for the maternal smoking study. We know that the two samples were independent, representative of the populations of interest, and large.
Question 3
3) Group 1 consists of mothers who smoked during pregnancy, and Group 2 consists of mothers who did not smoke during pregnancy.
a) What is the parameter of interest?
b) Write the null and alternative hypotheses, with proper notations for each.
The test statistic to compare two population means is calculated using the following formula:
[latex]t=\frac{estimate\;of\;parameter-null\;hypothesis\;value}{standard\;error}=\frac{(\bar{x}_{1}-\bar{x}_{2})-(\mu_{1}-\mu_{2})}{\sqrt{\frac{s^{2}_{1}}{n_{1}}+\frac{s^{2}_{2}}{n_{2}}}}[/latex]
Question 4
4) Use the DCMP Compare Two Population Means tool at https://dcmathpathways.shinyapps.io/2sample_mean/ to complete the test. Select “Summary Statistics” and enter the values from the following table:
| Group 1:
smoke_now = Yes Mothers who smoked during pregnancy |
Group 2:
smoke_now = No Mothers who did not smoke during pregnancy |
|
| Sample Mean | [latex]\bar{x}_{1}[/latex] = 114 | [latex]\bar{x}_{2}[/latex] = 123 |
| Sample Standard Deviation | [latex]s_{1}[/latex] = 18.2 | [latex]s_{2}[/latex] = 17.3 |
| Sample Size | [latex]n_{1}[/latex] = 480 | [latex]n_{2}[/latex] = 733 |
a) What is the value of the test statistic?
b) What is the P-value?
c) Given a 5% significance level, what do you conclude? Write your conclusion in context and support your answer.
d) Is this conclusion consistent with what you concluded using only the visualizations in Question 1?
Question 5
5) We often learn more from constructing confidence intervals than from the hypothesis test because it shows a range of plausible values for the difference between the population means.
a) Use the same DCMP tool to calculate and interpret the 95% confidence interval to estimate the difference in the population means. Round your answer to the nearest hundredth.
b) Interpret the result. Include the relevance of 0 in your description.
Question 6
6) An original article published in 1972 in the Journal of Epidemiology concluded that there was “a positive association between maternal cigarette smoking and reduced infant birth weight.”
a) Why did the authors choose the word “association” rather than “causation?”
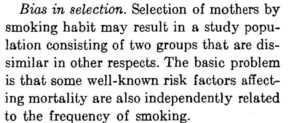
b) Read the following excerpt from the same article. Discuss how this statement might impact your conclusion.