In the next preview assignment and in the next class, you will need to think critically about the number of “successes” that would occur if a chance experiment were repeated multiple times.
How Many “Successes” Do We Expect?
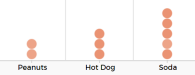
At a college baseball stadium, every game features a race between three mascots: one dressed as a peanut, one dressed as a hot dog, and one dressed as a cup of soda. The winner of the race determines what discount will be available at the concession stand for the rest of the game: $1 bags of peanuts, $1 hot dogs, or $1 soft drinks. For now, let’s assume that all three mascots are equally likely to win the race, and each race is independent.
Question 1
Fill in the following table with the probability of each mascot winning the race.
| Outcome | Probability |
| Peanut | |
| Hot Dog | |
| Soda |
Let’s say you plan to attend two games. Let’s list all possible outcomes for the two races. “Peanut – Peanut” means the peanut wins in both the first race and the second race, “Peanut – Hot Dog” means the peanut wins in the first race and the hot dog wins in the second race, and so on.
| Peanut – Peanut | Hot Dog – Peanut | Soda – Peanut |
| Peanut – Hot Dog | Hot Dog – Hot Dog | Soda – Hot Dog |
| Peanut – Soda | Hot Dog – Soda | Soda – Soda |
Question 2
Maybe your favorite snack to eat during a baseball game is peanuts.
- For each of the nine outcomes, record the number of times the peanut wins by writing the number in the previous table.
- Assuming all three mascots are equally likely to win in each race, what is the probability that the peanut will win 0 times out of the two baseball games you attend? Write your answer as a fraction.
- Assuming all three mascots are equally likely to win in each race, what is the probability that the peanut will win 1 time out of the two baseball games you attend? Write your answer as a fraction.
- Assuming all three mascots are equally likely to win in each race, what is the probability that the peanut will win 2 times out of the two baseball games you attend? Write your answer as a fraction.
- Fill in the following table to show the probability of each number of peanut wins.
Number of Wins (Peanut)
Probability - Compare the table in Question 1 to the table in Question 2, Part E. How are they different?
The previous probability calculations were based on a list of all possible outcomes. This is a reasonable approach for two races because the list of outcomes is fairly short, but it wouldn’t work well for a larger set of races. For 10 races, there would be over 50,000 possible outcomes!
Another approach would be to estimate the probabilities empirically using a simulation. Since we’re assuming all three mascots are equally likely to win in each race, a statistics class decides to carry out the simulation by rolling dice: 1 and 2 represent Peanut, 3 and 4 represent Hot Dog, and 5 and 6 represent Soda.
How many times would you expect to get discounted peanuts if you attended 10 games? The following plot shows one possible set of 10 races, based on a student’s simulation using dice.
Question 3
What does each dot in the plot represent?
- The winner of one race
- The number of times the peanut won in a set of 10 races
Question 4
In this simulated set of 10 races, how many times did the peanut win?
Question 5
If another student used the same approach to simulate 10 races using dice, would they get the same results?
Suppose there are 24 students in a statistics class. Each student simulated a set of 10 races by rolling a fair die 10 times and recording how many times the peanut won.
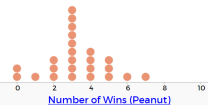
Question 6
What does each dot in the plot represent?
- The winner of one race
- The number of times the peanut won in a set of 10 races
Question 7
Based on the previous dotplot, estimate the following probabilities. Give your answer as a simplified fraction and a decimal rounded to the nearest thousandth.
- Estimate the probability that the peanut will win exactly 3 times out of 10.
- Estimate the probability that the peanut will win 6 or more times out of 10.
- Estimate the probability that the peanut will win 2 or fewer times out of 10.
- Compare the probabilities in Parts B and C. Which of these events is less likely? How can you tell by looking at the simplified fractions?
- Compare the probabilities in Parts B and C. How can you tell which value is smaller by looking the decimals?
