In the next preview assignment and in the next class, you will need to make connections between frequency, relative frequency, and probability. You will also need to interpret tables and graphs in order to calculate probabilities.
Frequency, Relative Frequency, and Probability
In the upcoming preview and in-class activity, we will be analyzing results from a national survey of college students.[1] In this survey, participants were asked a number of health-related questions, including some related to travel, exercise, sleep, and more. In this corequisite support activity, we will explore the frequency, relative frequency, and probability associated with responses from this survey.
Question 1
One of the questions presented to the participating college students in the survey was, “Within the last 2 weeks, on how many days did you drive a car or other vehicle?”
The table displays the frequency distribution associated with the students’ responses.
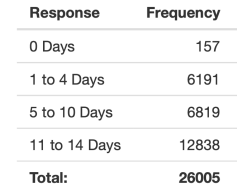
- According to the frequency distribution table, how many survey participants had driven a car or other vehicle on less than 5 days in the last two weeks?
Hint: Less than 5 days does not include ‘5 days’ (i.e., Reponses < 5). - According to the frequency table, how many survey participants had driven a car or other vehicle at least 1 day in the last two weeks?
Hint: At least 1 day means 1 day or more (i.e., Responses ≥ 1 day).
Question 2
Use the frequency table from Question 1 to address the following questions.
- What proportion of the college students in the survey stated that they had not driven a car or other vehicle in the last two weeks? Put another way, what is the relative frequency associated with the response “0 Days?”
- Calculate the proportion, or relative frequency, associated with the other responses to this survey question. Complete the following table. Round your answers to 4 decimal places.
Response Frequency Proportion / Relative Frequency 0 Days 157 1 to 4 Days 6,191 5 to 10 Days 6,819 11 to 14 Days 12,838 Total: 26,005 1 - According to your table, what proportion of the survey participants stated they had driven a car or other vehicle on more than 4 days in the last two weeks?
Hint: More than 4 days does not include ‘4 days’ (i.e., Reponses > 4).
- Suppose you randomly selected an individual who completed this survey. What is the probability of selecting a survey participant who responded with “1 to 4 days?”
Question 3
Another question presented to the students in the survey was, “In the last 7 days, on how many days did you do exercises to strengthen or tone your muscles? Examples include push-ups, sit-ups, or weightlifting/training.”
The frequency distribution associated with the student responses is presented in the bar graph below.
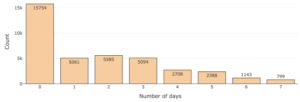
- According to the bar graph, how many college students in the survey answered this survey question? That is, what is the total number of responses?
- What proportion of the students in the survey stated that they had exercised their muscles on at least 5 days in the last week?
- Suppose you randomly selected a college student from those who participated in the survey. What is the probability that they did not exercise their muscles in the last week? That is, what is the probability of selecting a college student who responded “0 days?”
- Suppose you randomly selected a college student from those who participated in this survey. Are you more likely to select a student who exercised their muscles on 2 days in the last week or a student who exercised their muscles on 3 days in the last week? Explain.
Practice
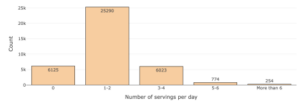
College students in this survey were asked, in the last 7 days, “how many servings of fruit did you eat on average per day?”
The bar graph below displays the frequency associated with the students’ responses.
Question 4
Use the information in the bar graph to complete the table below.
| Servings per day | Frequency | Proportion / Relative Frequency |
| 0 | ||
| 1 to 2 | ||
| 3 to 4 | ||
| 5 to 6 | ||
| More than 6 | ||
| Total: |
Question 5
How many college students consumed at least 3 servings of fruit per day?
Question 6
How many college students consumed less than 5 servings of fruit per day?
Question 7
If you randomly selected a student who participated in this survey, what is the probability that they consumed 0 servings of fruit per day?
- American College Health Association-National College Health Assessment. (2020). Undergraduate student reference group data report, Fall 2019. https://www.acha.org/NCHA/ACHA ↵
