Preparing for the next class
In the next in-class activity, you will need to understand the properties of continuous distributions and identify them from graphical displays. You will also need to identify features to create and label the graphs of normal distributions. Finally, you will need to identify the mean and standard deviation and estimate probabilities using a normal distribution.
Question 1
Below is a histogram of the sodium content in milligrams (mg) of 20 different cereals.[1]
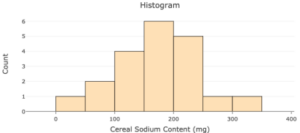
- How many cereals had less than 100 mg of sodium?
Hint: Remember the height of each bar corresponds to a frequency. - What percentage of cereals contained less than 100 mg of sodium?Hint: Think about how many cereals out of the total had less than 100 mg.
Question 2
Recall from In-Class Activity 8.A that in continuous probability distribution, probabilities are represented as areas under a curve. Below you can see the histogram from Question 1 modeled by a curve. Note that models are not perfect representations of the data.
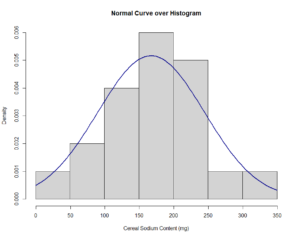
The figure above has a similar shape as the histogram in Question 1, with a few differences. The y-axis is now labeled “density.”
To understand density, let’s focus on the area in the first bar that represents the cereals with sodium contents between 0 and 50 mg. We know from Question 1 that the percentage of cereals that have less than 50 mg of sodium is [latex]\frac{1}{20}[/latex], or 0.05 (5%). Thus, the shaded area of the density plot that is less than 50 mg of sodium is [latex]50*0.01 = 0.05[/latex], where 0.01 is the height of the rectangle and 50 is the width.
- In Question 1, we found the percentage of cereals that contained less than 100 mg of sodium. Shade in the bars in the histogram above that correspond to this percentage. About what percentage of the total area of the bars do you have shaded in?Hint: Recall your answer to Question 1.
- Based on the curve alone, about what percentage of cereals do you think have less than 100 mg of sodium?Hint: What percentage of the area under the curve is below 100?
- Suppose all of the bars in the histogram were shaded. What would the total area in the bars be?
- Suppose the entire area under the curve was shaded. What would the total area under the curve be?
Question 3
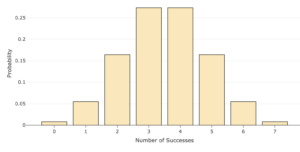
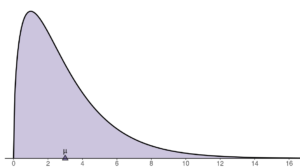
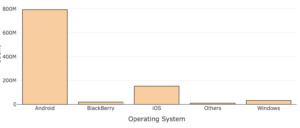
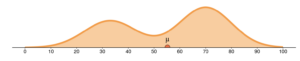
Choose the graphs that display continuous distributions. Choose all that apply.
One of the most common types of continuous distributions used in statistics is called the normal distribution. The model in Question 2 is a normal distribution. A normal distribution has the following characteristics:
- [latex]x[/latex] is a continuous random variable.
- Symmetrical around the mean, [latex]\mu[/latex], the left side is a mirror image of the right side centered at the mean.
- Bell shaped—there is one peak (unimodal) at the mean, median, and mode.
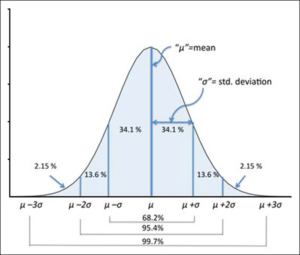
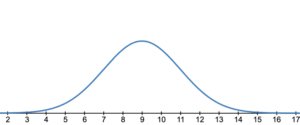
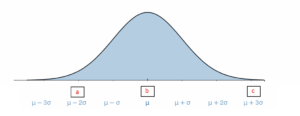
The following graph displays a normal distribution.[2] Recall the Empirical Rule from In-Class Activity 4.E. We know that 99.7% of the data fall within three standard deviations of the mean, so for normal distributions, we will be generally concerned with looking at values within [latex]\pm3[/latex] standard deviations ([latex]\sigma[/latex]) of the mean ([latex]\mu[/latex]). If we know that data is normally distributed and we know the mean and standard deviation, we can draw the graph for the normal distribution.
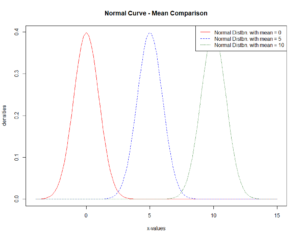
The normal distribution is centered at the mean. Sometimes the mean is called the “location parameter.” The value of the mean gives the location of the distribution on the x-axis. Looking at the following graphs, the mean of the red graph (on the left) is 0, the mean of the blue graph (in the middle) is 5, and the mean of the green graph (on the right) is 10. As you can see, as the mean increases, the graphs shift to the right on the x-axis.
Question 4
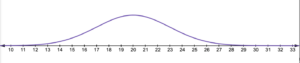
For each of the following two normal distributions, state the value for the mean.
Question 5
Which of the following graphs follows a normal distribution?
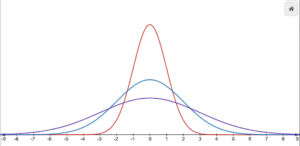
The shape of a normal curve will depend on the standard deviation. The standard deviation, [latex]\sigma[/latex], is often referred to as the shape parameter. The shape of a normal curve will still be bell shaped and unimodal, but the standard deviation will change how spread out or flat the curve appears. In the following figure, all three curves have different heights and widths, but they are all still normal distributions with the same mean. As the standard deviation increases, the curve gets flatter. The standard deviation of the red curve (the tall curve) is 1, the standard deviation of the blue curve (the middle curve) is 2, and the standard deviation of the purple curve (the shorter curve) is 3.
Question 6
Go to the Normal Distribution tool at https://dcmathpathways.shinyapps.io/NormalDist/.
- Change the mean value from 0 to -2 and notice what happens. Now change the mean value from -2 to 2 and notice what happens. Describe what you noticed.
- Change the standard deviation. What happens to the curve as the standard deviation gets larger? What happens as the standard deviation gets smaller?
Question 7
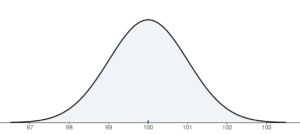
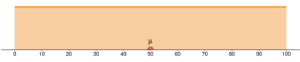
Suppose we know that for a certain normal distribution, the mean is 100 and the standard deviation is 5. We can then draw a bell curve and label the mean, the 3 standard deviations below the mean, and the 3 standard deviations above the mean. Calculate the values in the three boxes (a, b, and c) on the normal distribution below where [latex]\mu[/latex] = 100 and [latex]\sigma[/latex]= 5.
Question 8
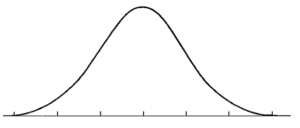
The following normal distribution shows the distribution of birth weight for newborn babies.
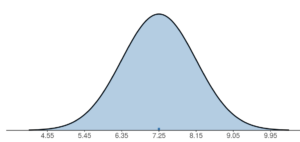
- What is the mean ([latex]\mu[/latex]) birth weight of the newborn babies?
- What is the standard deviation ([latex]\sigma[/latex]) of the birth weights for the newborn babies?Hint: Remember that the first value above the mean would be one standard deviation above the mean, the second would be two standard deviations above the mean, and so on.
Question 9
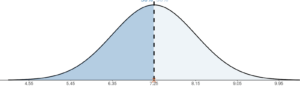
In a normal curve, probabilities are found by calculating the area under the curve. What proportion of newborns would you expect to weigh less than 7.25 pounds?
- 0
- 0.25
- 0.50
- 0.75
- 1.0
Hint: How much of the area under the curve is shaded dark blue?
Question 10
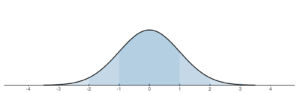
A normal distribution with a mean ([latex]\mu[/latex]) = 0 and a standard deviation ([latex]\sigma[/latex]) = 1 is called the standard normal distribution. The standard normal distribution can be seen below. Label the missing values on the horizontal axis.
Hint: Remember that the first value above the mean would be one standard deviation above the mean, the second would be two standard deviations above the mean, and so on.
