In the next preview assignment and in the next class, you will need to use normal distributions to calculate probabilities. The Empirical Rule can help you estimate probabilities.
The Empirical Rule
You may remember that the Empirical Rule helps us identify which values in a large dataset are usual or unusual. The range of usual values can be calculated with just the mean and standard deviation, but the distribution of values is often represented using a graph. The Empirical Rule is appropriate when the dataset is normally distributed. The normal distribution is a bell-shaped curve that is symmetrical and gradually approaches the x-axis in both directions. The area under the curve represents the percentage of values that fall in that range.
Question 1
For a normal distribution, where do you expect most of the values to fall? Where would the fewest values fall?
Question 2
Recall that z-scores represent distance from the mean. Z-scores can also be represented on the normal curve. In Parts A through C, use the graph to help you complete the statement.
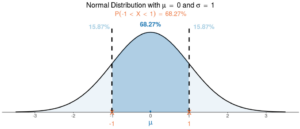
- The first part of the Empirical Rule states that approximately ______% of values fall within one standard deviation above and below the mean.
Graph:
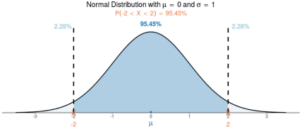
- The second part of the Empirical Rule states that approximately ______% of values fall within two standard deviations above and below the mean.
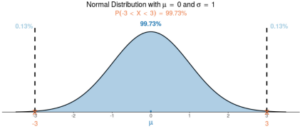
- The third part of the Empirical Rule states that approximately ______% of values fall within three standard deviations above and below the mean.
Question 3
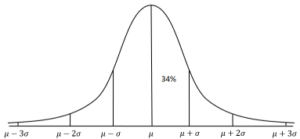
Complete the following graph by writing the approximate percentages contained in each section. One has been completed for you.
Question 4
The following normal distribution represents the probability distribution of the heights (in inches) of a group of women.
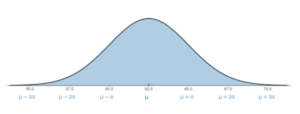
- Complete the following table based on the previous graph. Hint: Compare this graph to the standard normal
z-score Value (in inches) -3 -2 -1 0 1 2 3 - Approximately what percentage of women would have heights between 60 and 65 inches?
- Approximately what percentage of women would have heights between 57.5 and 67.5 inches?
- Approximately what percentage of women would have heights between 55 and 70 inches?
Question 5
The following normal distribution represents the salaries of the teachers employed by a small city (in dollars per year).
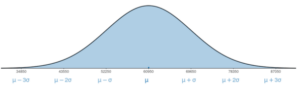
- What is the mean teacher salary in the city?
- What is the standard deviation for the data? Explain.
- Approximately what percentage of teachers earn between $52,250 and $60,950 per year?
- Approximately what percentage of teachers earn less than $52,250 per year?
