Preparing for the next class
In the next in-class activity, you will need to understand that every value of a variable with a normal distribution has a corresponding z-score for the standard normal distribution, and you will use technology to calculate probabilities for normally distributed variables. You will also need to use technology to calculate a corresponding value of a random variable for a given percentile and use the Empirical Rule to identify values that are usual and unusual.
Question 1
According to the Empirical Rule, what percentage of values will be contained between one standard deviation below the mean and one standard deviation above the mean?
- 34%
- 50%
- 68%
Questions 2 and 3: Go to https://dcmathpathways.shinyapps.io/NormalDist/ to open the DCMP Normal Distribution tool.
Question 2
According to the Empirical Rule, what percentage of values will be contained between one standard deviation below the mean and one standard deviation above the mean?
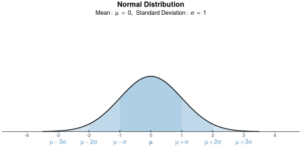
Which of the following describes what the numbers on the following graph (1, 2, 3, etc.) represent?
- Z-scores
- Standard Deviation
- Number of occurrences
- Probability
Hint: Review the standard normal curve.
Question 3
At the top of the DCMP Normal Distribution tool, choose the Find Probability tab.
- Let’s find the exact probability that a normally distributed random variable is within one standard deviation of the mean.
To find the probability that a random variable will be between two specified values, set “Type of Probability” to “Interval: [latex]P(a < X < b)[/latex].” What is the probability that a random variable that has a standard normal distribution will be between −1 and 1? Hint: Use the “Value of a” box to set your lower value and the “Value of b” box to set your upper value. Remember that the shaded part of the graph represents the probability. - What do you notice about your answer for Part a? Hint: Remember the Empirical Rule.
Questions 4 and 5: Continue using the DCMP Normal Distribution tool to complete any necessary calculations.
Question 4
Recall Question 3 from Practice Assignment 8.D. The average body temperature for healthy adults is 98.2°F with a standard deviation of 0.73°F.
- What is the probability a randomly selected healthy adult will have a temperature below 98.6°F? Write your answer as a proportion. Include 4 decimal places in your answer.
Hint: Use the lower tail probability. - What is the probability a randomly selected healthy adult will have a temperature above 100.4°F?
Hint: Use the upper tail probability.
- A fever is considered medically significant if body temperature reaches 100.4°F. What do you observe about this temperature? Do you think this temperature is medically significant?
Hint: Think about z-scores. How many standard deviations above the mean is this temperature?
Question 5
One thousand high school juniors take a standardized exam. The distribution of student scores approximates a normal distribution with an average score of 68.4 and a standard deviation of 6.8.
- What percentage of students passed the exam with a score of at least 65? Hint: Use the upper tail probability.
- Students who scored between 55 and 65 are given the chance to take the exam again to improve their scores. What percentage of students will have the chance to retake the exam?
Hint: Use the interval probability.
- Fill in the blanks. Round to the nearest hundredth.
Approximately 68% of all scores are between _____ and _____.
Approximately 95% of all scores are between _____ and _____.
Approximately 99.7% of all scores are between _____ and _____.
Hint: Remember the Empirical Rule.
- On their score reports, students are told how their scores compare to other students’ scores. For example, a student might be told that they scored better than 80% of their peers. We can use this information to estimate the students’ raw scores.
At the top of the DCMP Normal Distribution tool, choose the FindPercentile/Quantile tab. Set the mean to 68.4 and the standard deviation to 6.8. Use the tool to complete the following table. Round to the nearest hundredth.
-
Student Scored Better Than [latex]x[/latex]% of Peers
Approximate Raw Score
5% 20% 80% 99% Hint: Use the lower tail option to calculate the percentile.
