Adequate sleep is crucial for students to be healthy and successful. Sleep deprivation can affect memory, academic performance, physical health, and mental health.[1] College students often lack sleep, and some occasionally resort to pulling all-nighters.

Credit: iStock/SolStock
Question 1
The website Mattress Advisor claims that 20% of college students pull all-nighters each semester.[2] Do you think this claim is accurate? What information would be helpful to answer this question?
Question 2
In a previous activity, we looked at the percentage of college students who had pulled all-nighters. In the study, 34 out of 253 students said they had an all-nighter in the last semester.[3]
- Calculate the point estimate ([latex]\hat{p}[/latex]) for the proportion of college students who had pulled all-nighters.
- Looking at the point estimate alone, do you think the claim by Mattress Advisor is accurate?
- Why should we create a confidence interval if we already have an estimate for the population proportion?
In order to create a confidence interval for proportions, we need to verify that the sampling distribution of the sample proportions is approximately normal. Recall the following conditions that must be satisfied:
- Random samples: The observations represent a random sample of the population.
- The sample is less than 10% of the population.
- Sample size: The sample is large enough that [latex]n\hat{p}\geq 10[/latex] and [latex]n(1 − \hat{p}) \geq 10[/latex].
Question 3
We will assume that random sampling is used and that the sample is less than 10% of the population. Verify the sample size condition so that we may assume that the sampling distribution of the sample proportions is approximately normal.
Question 4
Rather than using a simple point estimate, let’s calculate confidence intervals for a population proportion using the DCMP Inference for a Population Proportion tool at https://dcmathpathways.shinyapps.io/Inference_prop/ for the study, where 34 out of 253 students said they had all-nighters in the last semester.[4]
- Change the “Enter Data” box to “Number of Successes.”
- Input the sample size ([latex]n[/latex]) and the number of successes ([latex]x[/latex]), which in this case is the number of students who pulled all-nighters.
- Specify appropriate labels for success/failure by checking the appropriate boxes and typing in labels. For example, we can label success as “All-nighters” and failure as “No all-nighters.”
- Slide the confidence level to the desired level. The default is 95%
- View the z critical value by selecting the box “Show z-score for Margin of Error.”
- The confidence interval will appear to the right along with the point estimate, standard error, margin of error, and z critical value (labeled as “z-score”).
- What is the standard error for the proportion of college students who had all nighters?
- Assume the level of confidence is 95%. What is the z critical value, [latex]z^{*}[/latex], that corresponds to the confidence level?
- Calculate the margin of error for the sample proportion of college students who had all-nighters from the equation for the margin of error ([latex]E[/latex]):[latex]E = z^{*} \bullet (standard~error)[/latex]Notice how the values in the web tool match the calculated value from the equation.
Question 5
Now let’s estimate the proportion of college students who had all-nighters by creating a 95% confidence interval.
- Begin by writing the confidence interval in both [latex]\pm[/latex] format and interval notation form (lower bound, upper bound).
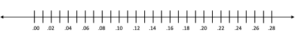
- Represent the confidence interval on the following number line. Include the point estimate, upper bound, and lower bound.
Question 6
Use the DCMP tool to calculate the 99% confidence interval for the proportion of college students who had all-nighters.
- Write the 99% confidence interval using interval notation form (lower bound, upper bound).
- How is this confidence interval different from the 95% confidence interval?
- Looking at the point estimate, standard error, z critical value, and margin of error, what do you think contributed to the change from the 95% confidence interval to the 99% confidence interval?
- What do you think would happen to the length of the interval if we changed it to 90% confidence?
Question 7
Based on your answers to Questions 4 and 5, do you think there is evidence to support the claim from Mattress Advisor? Explain.
- Bullock, L. (2021, March 19). College student sleep statistics. Mattress Advisor. https://www.mattressadvisor.com/college-sleep-statistics/ ↵
- Bullock, L. (2021, March 19). College student sleep statistics. Mattress Advisor. https://www.mattressadvisor.com/college-sleep-statistics/ ↵
- Onyper, S., Thacher, P., Gilbert, J., & Gradess, S. (2012). Class start times, sleep, and academic performance in college: A path analysis. Chronobiology International, 29(3): 318–335. ↵
- Onyper, S., Thacher, P., Gilbert, J., & Gradess, S. (2012). Class start times, sleep, and academic performance in college: A path analysis. Chronobiology International, 29(3): 318–335. ↵
