Drug abuse is a serious problem among adolescents in the United States. The National Institute on Drug Abuse (NIDA), part of the National Institutes of Health, funds studies that investigate sources and changes in drug abuse among teens.
A study conducted by the University of Michigan challenges the idea that reducing adolescent drug use can be achieved solely by limiting the supply of the drugs. The data for the University of Michigan study came from the annual Monitoring the Future (MTF) survey[1] of substance use behaviors and related attitudes among adolescents in the United States.

Credit: iStock/GoodLifeStudio
Question 1
The MTF survey is given to adolescents and is completed and submitted anonymously. Why do you think it is important to administer the survey this way?
Question 2
The NIDA was interested in the effects of the 2020 pandemic on drug abuse in teens. In particular, they were interested in understanding the change between pre pandemic vaping usage and vaping usage three months into the pandemic. Before the pandemic, 24% of 12th graders reported that they had vaped nicotine in the past 30 days. The study included 582 12th graders who anonymously completed the MTF survey. Three months into the pandemic, 17% of 12th graders reported that they had vaped nicotine in the past 30 days.
- What is the null hypothesis for the study?
- What is the alternative hypothesis?
- Assume all conditions for a one-sample z-test of proportions are met. Using the DCMP Inference for a Population Proportion tool at https://dcmathpathways.shinyapps.io/Inference_prop/, calculate the P-value for the test.
- At the 5% significance level, do you reject the null hypothesis? Part E: What is the conclusion?
- Was your conclusion in Part E statistically significant? Was it practically significant?
- Can you be absolutely certain in your conclusion? In other words, can you be absolutely 100% certain of your conclusion?
Errors sometimes arise in hypothesis testing. This is because we are reaching a conclusion about the entire population based on a sample. We cannot eliminate hypothesis testing errors entirely.
Sometimes, due to chance, the result of the hypothesis test does not align with reality. If we reject a correct null hypothesis, we are committing a type I error. If we do not reject a null hypothesis that is actually incorrect, we are committing a type II error.
| Reject the null hypothesis | Do not reject the null
hypothesis |
|
| Null hypothesis is correct | Type I error | No error |
| Null hypothesis is incorrect | No error | Type II error |
Question 3
Describe, in the context of Question 2, a type I error. What might happen if a type I error occurs?
Question 4
Describe, in the context of Question 2, a type II error. What might happen if a type II error occurs?
In general, how might a type I error arise? Let’s explore the sampling distribution of sample proportions under the null hypothesis.
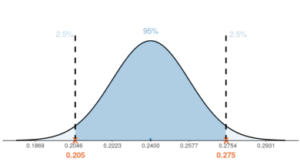
The figure illustrates our hypothesis test decision rule. If the actual sample proportion is greater than 0.275 or less than 0.205, we would reject the null hypothesis and conclude that there was a change in vaping rates.
But what if the vaping rates did NOT change, and you happened to select a sample proportion in the tails (shaded light blue) of the distribution? In other words, you selected a “lucky” sample that was simply unusual given that the null hypothesis of no change was true [latex](p=0.24)[/latex], which resulted in a small enough P-value to reject the null hypothesis. In this case, you would have committed a type I error.
Question 5
If you decide to reject the null hypothesis when the sample proportion is greater than 0.275 or less than 0.205, what proportion of the possible sample proportions under the null hypothesis [latex]p_{0} = 0.24[/latex] will result in a type I error?
Question 6
Suppose that you decide to reject the null hypothesis when the sample proportion is greater than 0.286 or less than 0.194. What proportion of the sample proportions under the null hypothesis [latex]p_{0} = 0.24[/latex] will result in a type I error?
Question 7
What are the significance levels in Questions 5 and 6?
Question 8
In which scenario, Question 5 or Question 6, is it harder to reject the null hypothesis?
How might a type II error arise? Imagine that there really was a change in vaping rates, but you erroneously failed to reject the null hypothesis and concluded that your sample did not provide enough evidence to suggest that the vaping rates changed.
As a researcher, there are two main reasons that you are not able to come to the correct conclusion:
- It is too hard to gather enough evidence to reject the null hypothesis. This is typically caused by a small sample size.
- It could be a case where the researcher simply had an “un-lucky” sample that resulted in a large P-value.
Question 9
Suppose instead of sampling 582 12th graders, a different study was only able to sample 100 students. Suppose that this sample similarly showed that 17% of 12th graders reported vaping within the last 30 days. The P-value for the test is 0.1012.
- At the 5% significance level, what should you conclude from this study?
- If there really was a change in vaping rates, what type of error did you commit?
Question 10
Is a type II error more likely to arise…
- With a sample that includes 582 students or 100 students? Explain.
- With a significance level of 0.01 or a significance level of 0.1? Explain.
Question 11
If you want to reduce the probability of a type I error, what can you do?
Question 12
If you want to reduce the probability of a type II error, what can you do?
- National Institute on Drug Abuse. (2021, May 20). Monitoring the future. https://www.drugabuse.gov/drug-topics/trends-statistics/monitoring-future ↵
